Dashboard
The admin UI is served by the admin service. Sign in with a username and password. Menu items you lack the permission for are hidden, and opening such a page by its address says your role cannot open it. On a narrow screen the menu opens from Menu at the top.
The bar at the top of every screen shows where policy stands, in the order a change travels: the shared draft (such as Unsaved edits, Same as live, or what is Not published, such as 1 rule changed; while a canary runs it is compared with the canary), a canary if one runs, and the live version.
The info mark beside a page or card title explains it; hover over it or click it.
Time range
The dashboard, Rules, a rule's Live card, Stats, a client's page, Routes, a route's page and Audit share one Time range: the last hour, 6 hours, 24 hours (the default), 7 days or 30 days. The address keeps it as ?range=1h, 6h, 7d or 30d, and links carry it to the next screen, so a range picked on the dashboard holds on the others and in a bookmarked or shared link. On the dashboard, Rules, a rule's Live card, Stats and a client's page, Live beside it means the figures refresh, every 10 seconds up to 24 hours and every minute for longer ranges; it reads Not updating when they can't.
Find
Press Cmd+K (Ctrl+K on Windows and Linux) on any screen to open Find. Type part of a rule ID, a live autopilot rule ID (which opens the case that made it), a route (method, host and path), a version number or message, a username, an autopilot case (Case 12) or an autopilot note (Note 3, or words from its statement); every word you type must appear; an exact name comes first, then names that start with the text as a whole word, then names that start with it. Arrow keys move through the matches and Enter opens one. A whole IP address or AS number, such as 203.0.113.24 or AS64500, opens that client's page; type an IPv6 client as Stats shows it, by its /64, such as 2001:db8:1:2::/64. Find offers only what your role can open: users need the admin role, routes and clients need the right to read stats, autopilot rules, cases and notes the right to read autopilot.
Roles
| Role | Can |
|---|---|
| viewer | Read config, stats, the audit log and autopilot (autopilot.read) |
| editor | Viewer, plus edit the draft and run tests |
| publisher | Editor, plus publish, revert and run canaries, delete or group routes, and investigate, approve and retire autopilot rules (autopilot.manage) |
| admin | Publisher, plus manage users, tokens and settings |
Overview
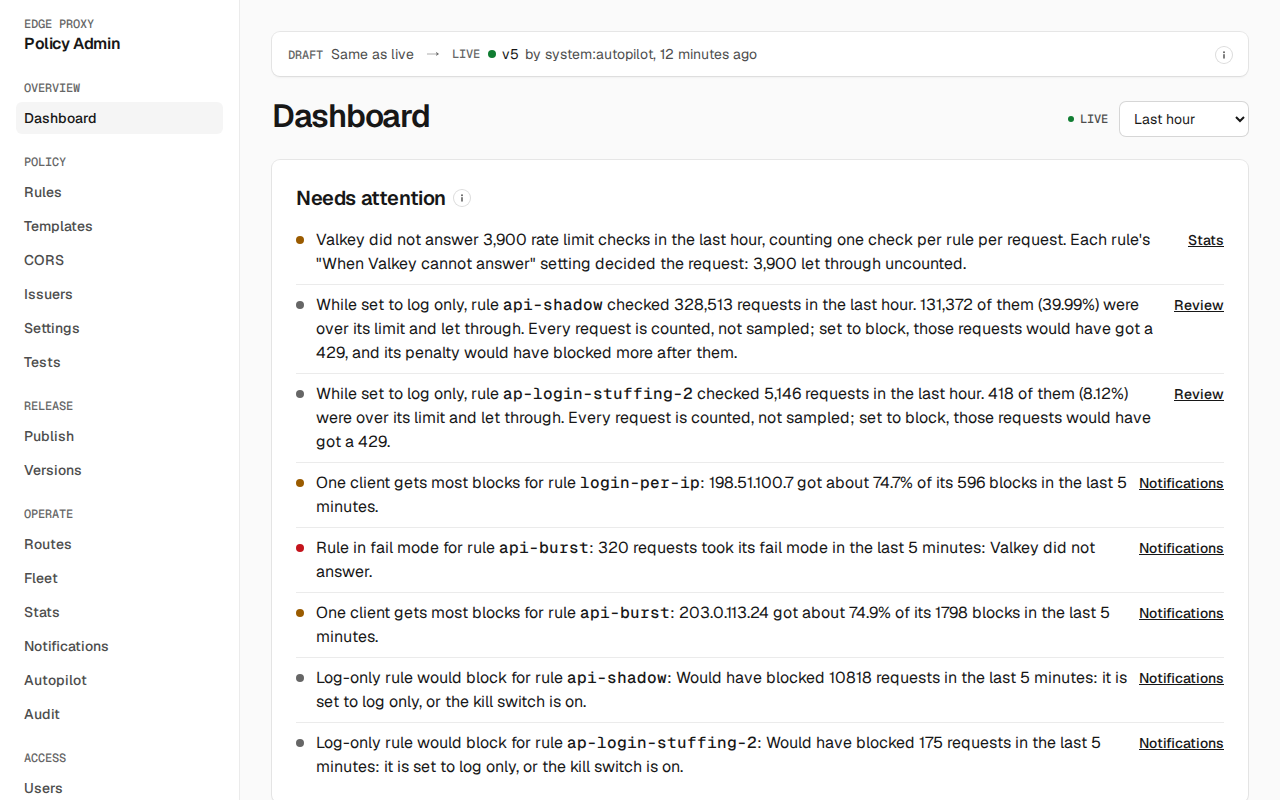
The first screen after sign-in. The time range picks the window for the traffic figures. Each panel is shown only to roles that can read its page, and links to it.
-
Needs attention lists what to act on, each read from admin: a state, or an anomaly the notification checks found firing. The dashboard sets no thresholds of its own:
- A kill switch is on (rate limiting, JWT checks or blocking by config rules): enforcement is off everywhere. Turn it off in Settings once the emergency is over.
- A canary was aborted, with its reason, or the guard rolled back a version: a canary, or a full publish it replaced with a copy of the version before. The line names the version edges now serve and, for a rollback, the signals that tripped and the version they were compared with. Fix the change in the draft and publish again; Publish shows how.
- The guard raised an alert on the live or canary version: the signals that tripped, the version they were compared with, and why the version stayed. Open the version and decide whether to keep or revert it.
- A canary is running, with its percent and start time. Promote or abort it in Publish.
- Live edges serve a cache or bootstrap snapshot because they can't get config from admin, or live edges have not loaded the live version. They keep serving an older policy; check them in Fleet.
- Valkey did not answer rate limit checks, split by what each rule's When Valkey cannot answer setting then did: let the request through uncounted, answered
503(a rule that fails closed, unless another rule answered429), or counted on the edge alone. Check Valkey; Stats has the counts per rule. - Log only rules had requests over their limit, up to three, with how many requests a block would have stopped. Review the rule before switching it to block.
- An anomaly is firing, with its summary, such as a surge in upstream 5xx; red is critical, amber a warning. A rule anomaly for the same signal as a firing fleet anomaly, such as upstream 5xx for one rule while upstream 5xx rise across the fleet, is listed under the fleet line instead of on its own. It fires only when the rule is out of line with the fleet, so it shows where the fleet anomaly is concentrated, not its cause. Notifications has the details.
- The audit log failed its tamper check, with the event where the chain broke. Open Audit.
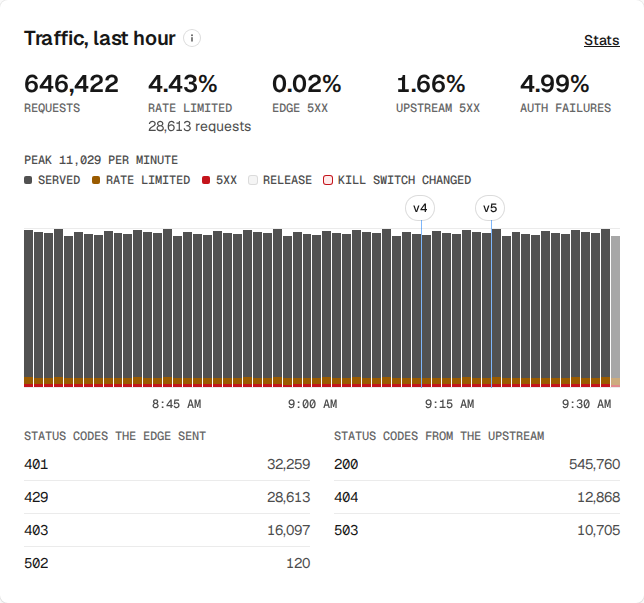
The rate limit counts include every request, not a sample, though a report an edge could not deliver is missing; each is read against the version that served it, so a rule changed during the range is counted by its settings at the time. A line goes away when its state does: there is nothing to dismiss, and the Audit log and Stats keep the history. With nothing to list, the panel says what it checked. - Traffic shows requests, and the share rate limited, edge 5xx, upstream 5xx and auth failures, over a chart of requests split into served, rate limited and 5xx. Below the chart, the commonest status codes the edge sent and those from the upstream, so a
502the edge sent because it could not reach the upstream reads apart from a502the upstream sent. Each bar is 1 minute for the last hour, 2 minutes for 6 hours, 10 minutes for 24 hours, an hour for 7 days and 6 hours for 30 days; the bar still in progress is paler. Marks above the chart are releases: a publish, revert, import, an autopilot publish, canary step, promote or abort, or a guard rollback or canary abort, each labelled with its version, such asv4. Hover over one for what happened and when, and click it to open the version. A red mark with square corners, Kill switch changed, is a release whose kill switch differs from the live version's; for a canary that is the canary's start, and the change applies to the canary's share of traffic. A range shows at most the latest 100 releases, and when more marks than fit the chart's width, kill switch changes and the newest are marked and the key says how many more there are. Releases show only to roles that can read the audit log. Hover a bar for its numbers. Drag across bars to zoom in to them, and the traffic and rate limiting figures follow, while Needs attention keeps the whole range; Reset zoom goes back. From the keyboard, focus the chart, move with the arrow keys, hold Shift to select, then press Enter to zoom or Escape to cancel. - Rate limiting lists the rules that blocked the most requests, or for log only rules found the most over their limit, and the most limited clients. A rule that limited requests but has no client in the ranking is named below it: each edge reports only its 20 most limited clients across all rules each minute, counted from 1 in 16 limited requests, and admin keeps the 20 most limited of each rule in each bar. - Live policy shows the live version and how many rules each phase has. - Fleet shows live and gone edges, the versions they have loaded and where their config came from. - Recent changes lists changes to policy, releases, settings, users, tokens and routes (deleted or grouped), without sign-ins or anomalies, with the latest audit chain check.
Counts of a million or more are shortened, such as 12.35M; hover over the request count for the exact number. The figures update as Time range says, and include the minute in progress: edges report every 10 seconds and admin writes what it has every 10 seconds, so a request shows within about 20 seconds.
Rules
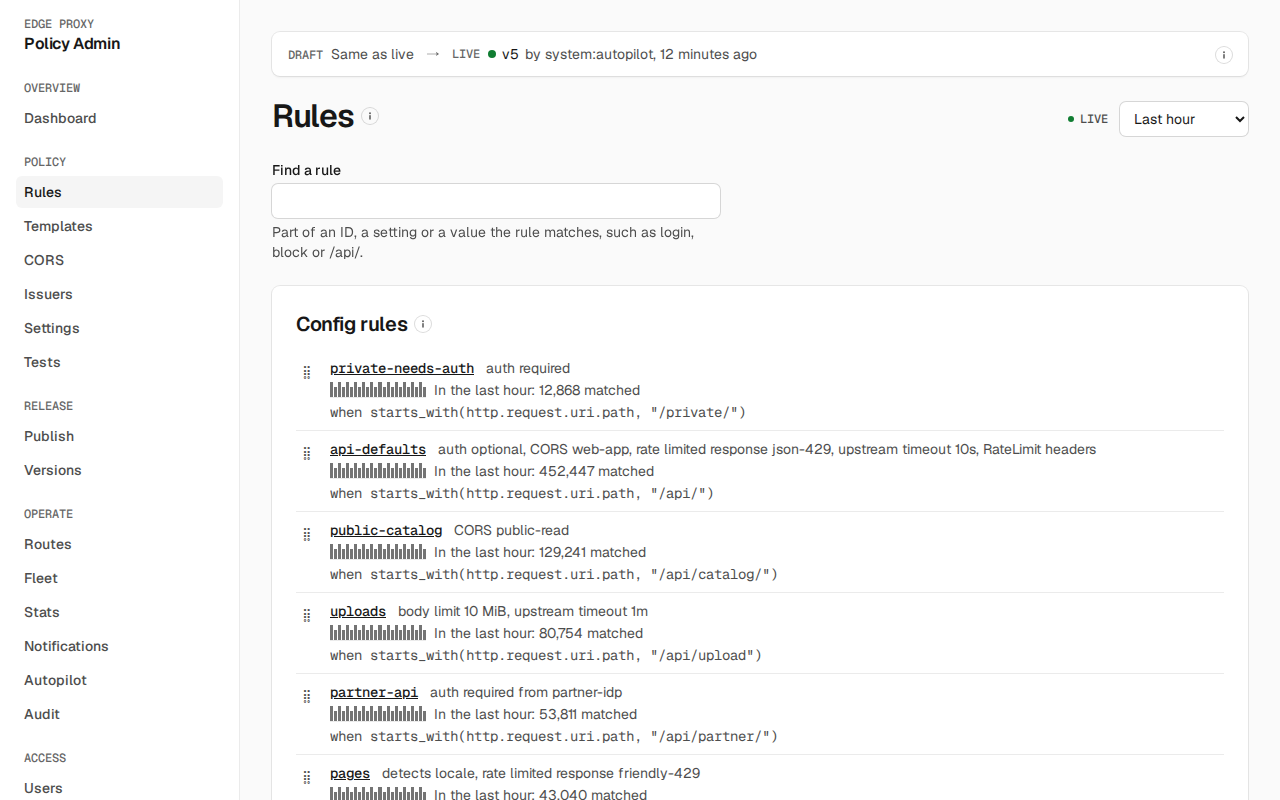
The three phases and their rules, in order, each with what it does and the condition it matches. A rate limit rule also shows its penalty and what it does when Valkey is down, unless it lets requests through. A rule that only logs (a rate limit rule set to log, or a config rule whose block is log) is marked log only. For roles that can read stats, each rule has a line of what it did over the time range, such as 1,204 matched · 38 blocked with 429, with a small chart of its matches. These counts are exact: every request is counted, for the version that served it. Drag a rule to reorder it. Add a rule to a phase with its button, such as Add rate limit rule, or open one to edit it. A rule with expires_at, yours included, shows when it expires. Find a rule shows only the rules whose ID, summary or condition contains what you type, such as login, block or /api/, with how many of each phase's rules are shown.
When the live version has autopilot rules, the rate limit card lists them under Autopilot rules, read-only, each marked autopilot with when it expires. They are not in the draft. An ID opens the Autopilot page with Find an autopilot rule set to it. With config.write, Adopt copies one into the draft as your own rule, without its ap- prefix and expiry; save or discard unsaved changes first. An adopted rule reads adopted, leaves autopilot on next publish until then.
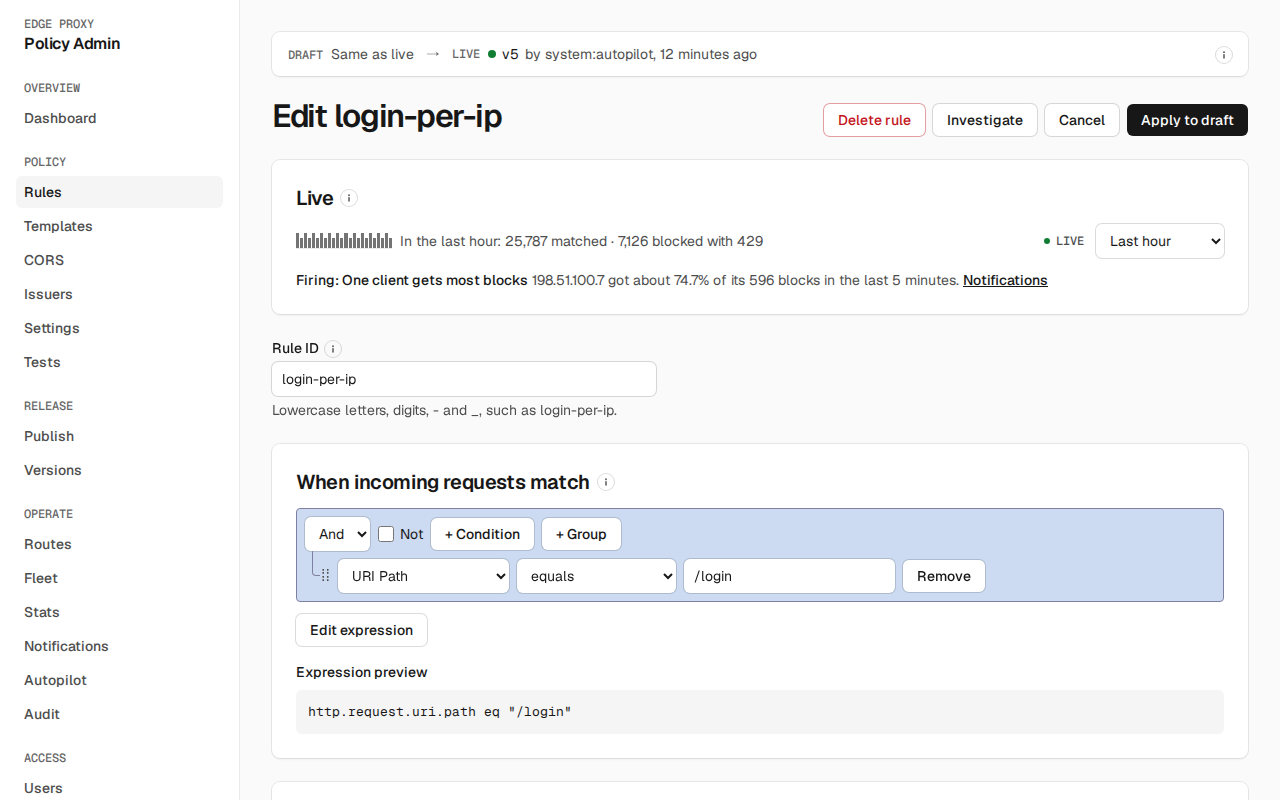
A rule's editor starts with Live: the same counts over the time range as on Rules, and any anomaly firing or pending on the rule, with a link to Notifications. A rule not yet published shows 0 matched. With autopilot.manage, Investigate asks the autopilot about the rule, with an optional question, and opens the case.
A rule's ID must be unique across all phases; Apply to draft stays disabled while another rule has it. When incoming requests match is the rule builder; Edit expression switches to text. The preview shows the expression as admin renders it, with any errors, for the builder and for text as you type.
Then is a form: every fixed value, and every name of something else (a CORS policy, issuer or template), is picked from a list, numbers and durations are a number and a unit, and a field that does not apply, such as burst for a window algorithm, is not shown. A response template is offered only for the kinds of error whose status it uses. As you edit, admin checks the draft with the rule in it, exactly as a save would: each problem appears under its field and in a list at the top, and Apply to draft stays disabled until there are none. A new rate limit rule starts as log only. Edit as JSON shows the same settings as JSON, with Fields and an example.
Apply to draft keeps the change in the browser; Save draft, in the bar at the top of the screen once you have unsaved edits or the starter draft has never been saved, validates and saves it for everyone. If someone else saves the draft first, the bar says who and when; discard and redo your changes on their version. When a save fails on a rule, the error links to that rule.
Templates, CORS, Issuers, Settings
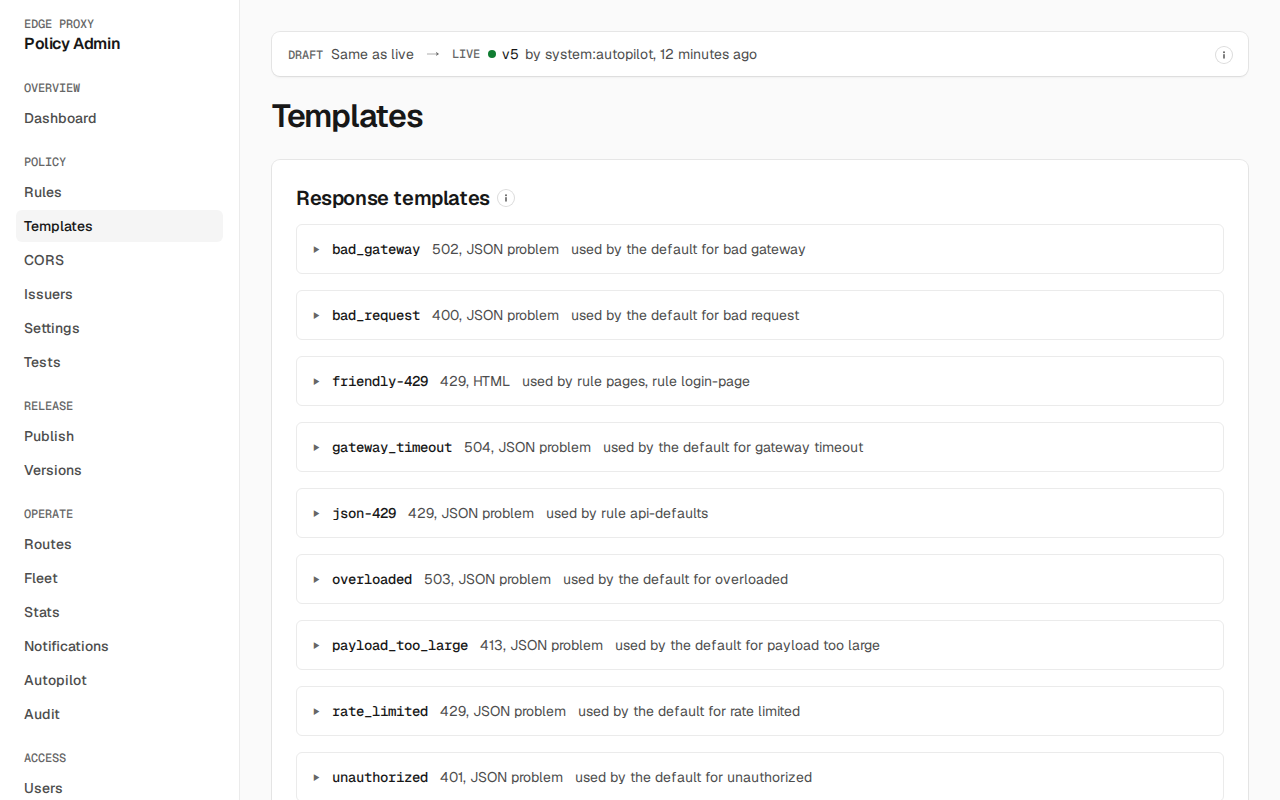
The shared parts of the policy, each a form that edits the draft directly:
- Templates: each response template's status, content type and body, and the template each kind of edge response uses by default, with when the edge sends that kind. Status and content type are picked from lists; a kind is offered only the templates with its status.
- CORS: each policy's allowed sites, methods (ticked from a list), the headers the page may send and read, whether browsers may send cookies, and how long browsers may reuse the answer.
- Issuers: each JWT issuer's ID,
issvalue, audiences, keys URL and signing algorithm (picked from a list), and the issuers rules accept by default (ticked). - Settings: the kill switches, the backstop, the defaults (body limit, timeouts, locale detection), locale and header forwarding.
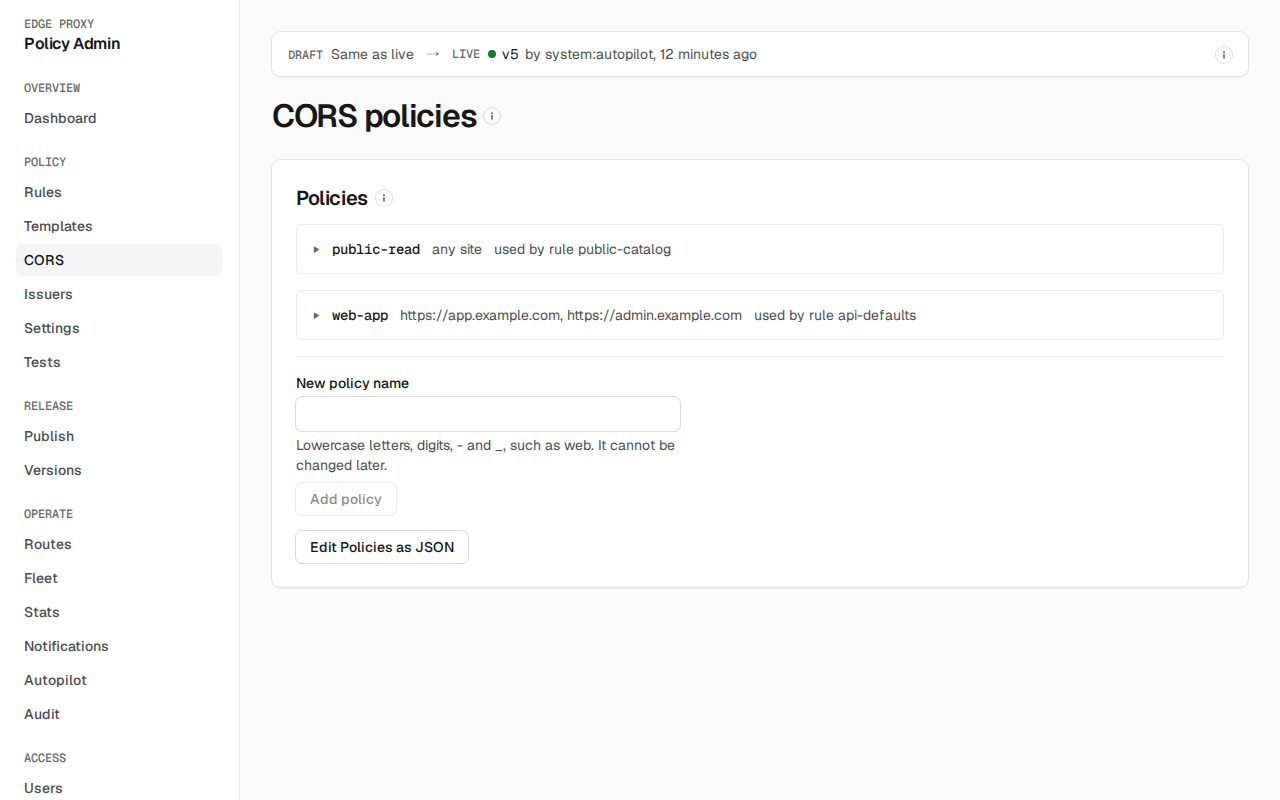
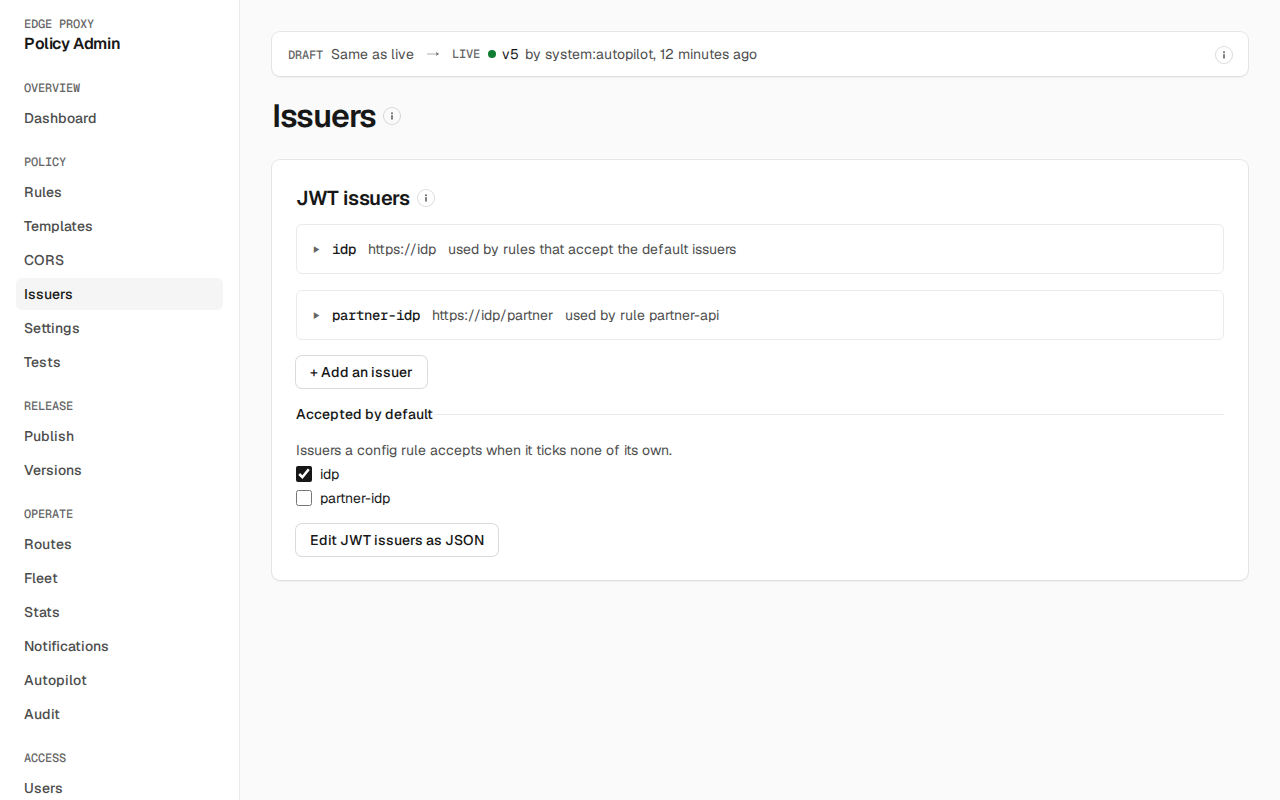
Each template, policy and issuer is one line that says what it is and what uses it, such as used by rule api-defaults, or not used; open it to edit. One with a problem opens by itself. A template or policy is added by name and removed with its button; its name cannot be changed. Lists such as allowed sites have one field per item. Every edit is checked by admin as a save would check it: each problem appears under its field and in the bar at the top, with a link to its page (in a rule editor the bar leaves out that rule's own problems), and Save draft stays disabled until there are none. Each form has Edit … as JSON, which shows the same section as JSON. Saving warns about a CORS policy no config rule selects, an issuer no rule accepts, and a template nothing sends: each saves but has no effect.
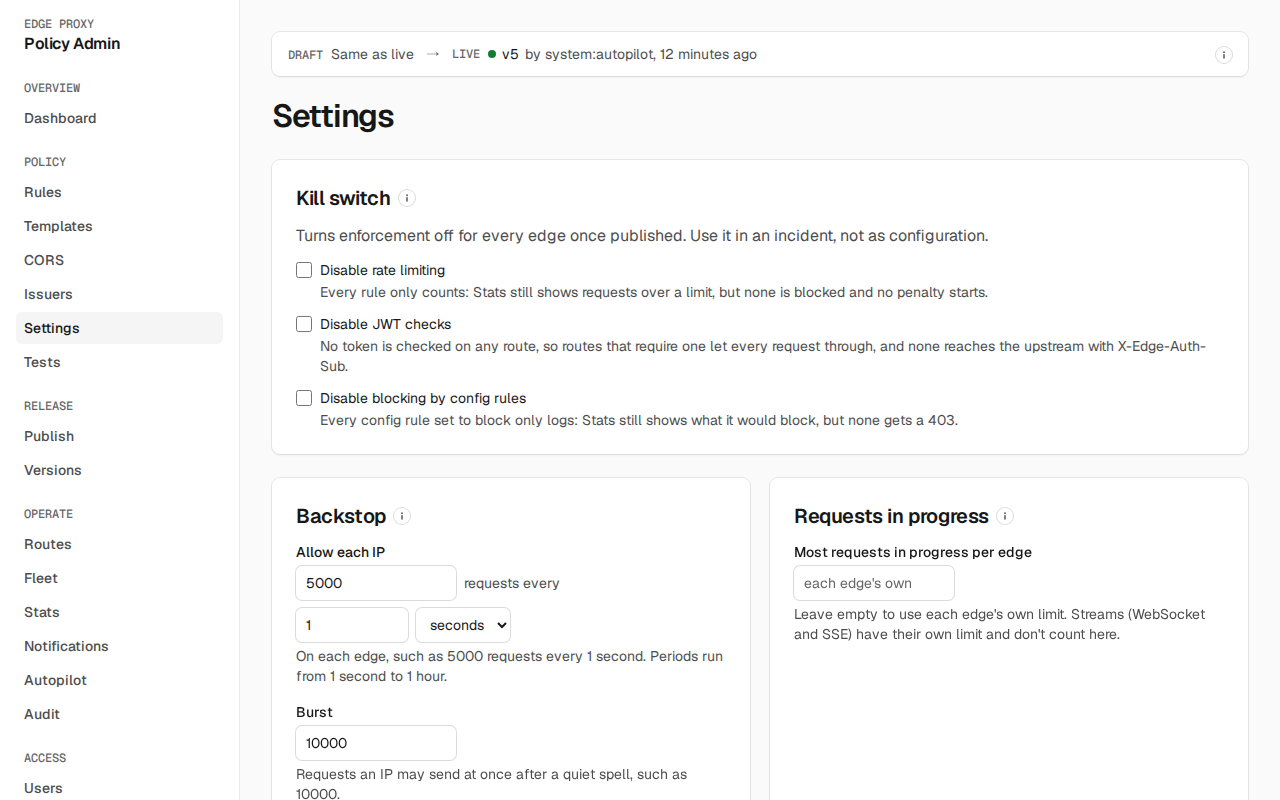
Settings also holds the rollback guard: a form with the watch time, the request and step minimums, and each check with whether it rolls back, alerts or is off, its thresholds and a sentence of when it trips. Edit as JSON shows the same settings as JSON. It applies at once rather than with the draft, and only an admin can save it.
Tests
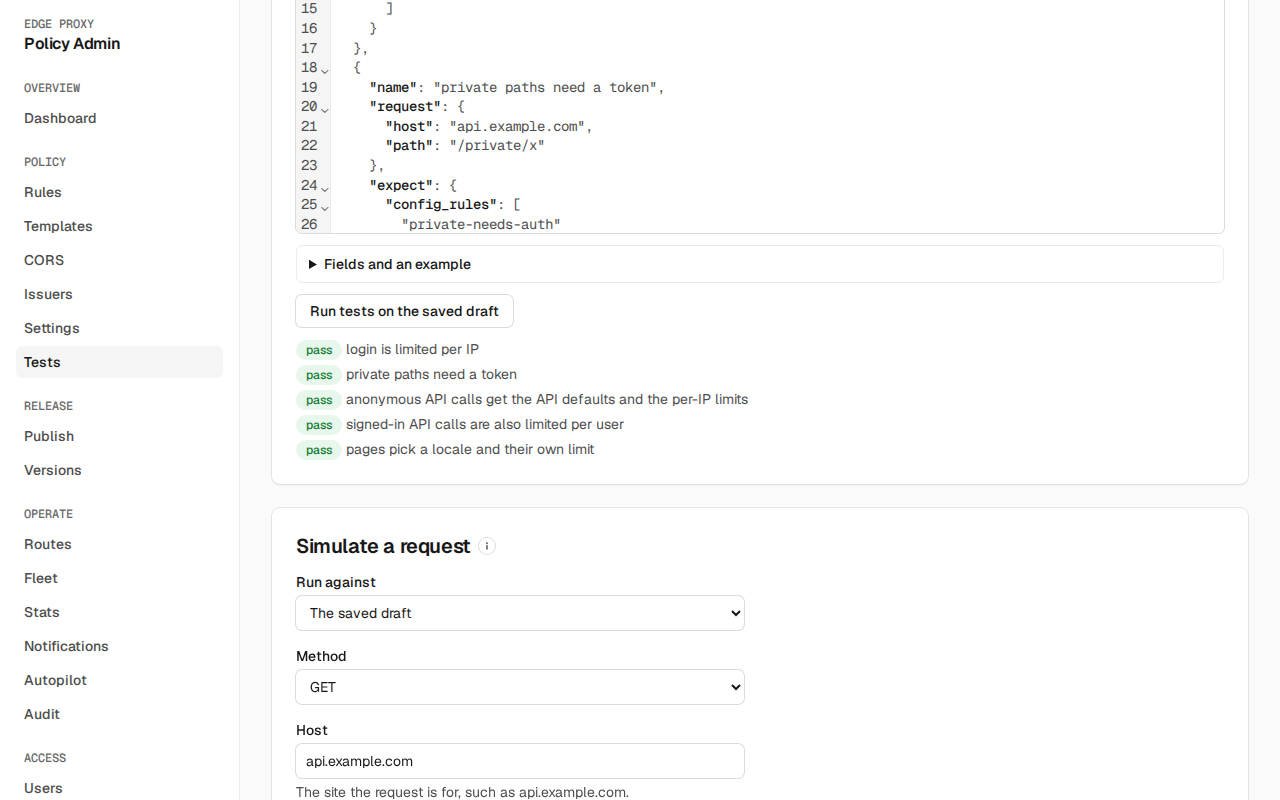
Run the draft's config tests, edited as JSON, or simulate one request against the saved draft or any published version and see the outcome, which rules match, what settings apply and which headers the upstream would receive. Simulate and the tests use the saved draft, so unsaved rule and setting changes are not in their results; the page says so while you have some. After simulating against the saved draft with no unsaved rule changes, Add as a test appends that request as a test expecting the same outcome and rules. The request is a form: method from a list, host, path, client IP, country, AS number, HTTPS, headers, and the claims of a verified token if it has one; Edit the request as JSON shows it as JSON. A request the simulator cannot run, such as one with a mistyped IP, shows the problem under its field. Failing tests block publish.
Publish
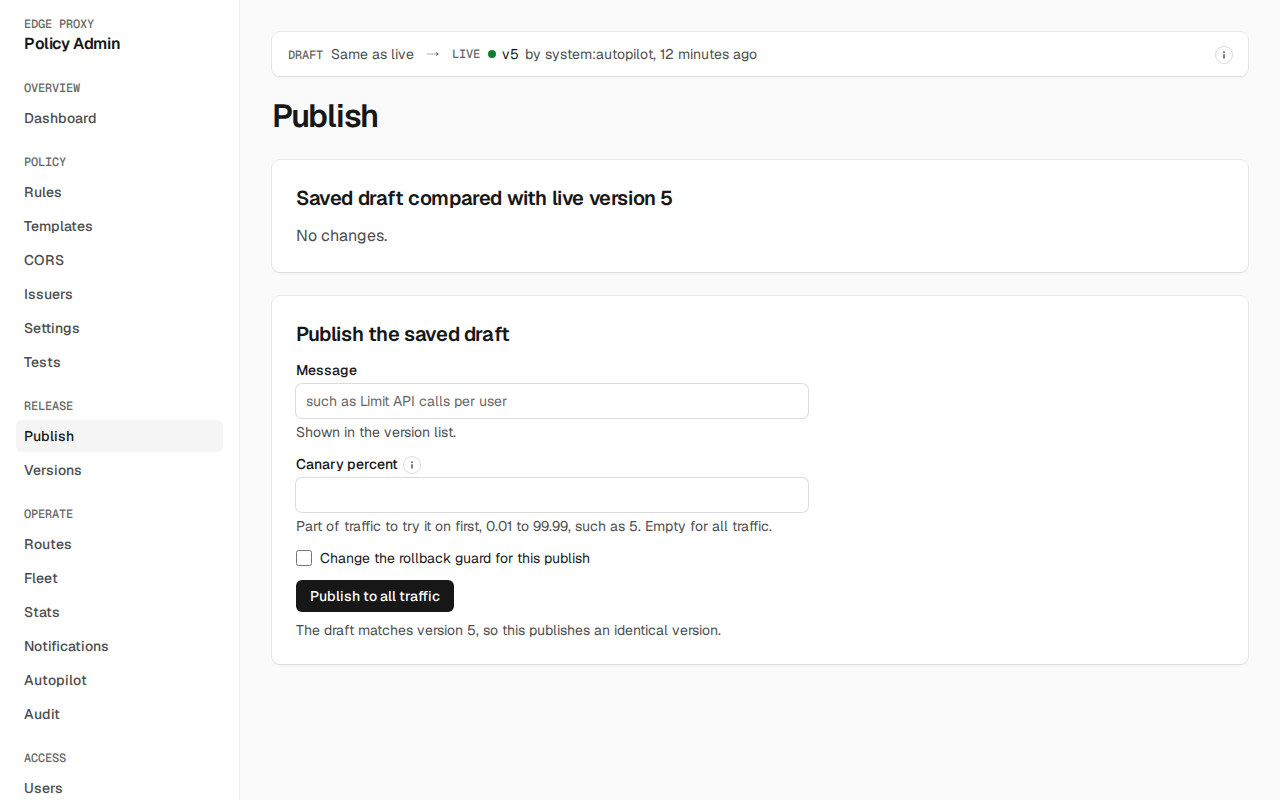
The saved draft compared with the live version, rule by rule; unsaved changes are not shown or published. Enter a message and press Publish to all traffic, or Publish to N% of traffic with a canary percent. Optional:
- Canary percent: send only part of the traffic to the new version, then step, promote or abort it here. The canary says when the guard allows the next step and how many requests the step has seen, or that it is ready; Step up and Promote to all traffic stay disabled until then. Abort works at any time once you enter an abort reason. If the guard raised an alert on the canary, the card and the promote dialog say which signals tripped. The percent may end in
%; anything that is not 0.01 to 99.99 blocks the publish. - Override reason: shown once a publish is refused because an issuer's keys were never fetched; give a reason to publish anyway.
- Change the rollback guard for this publish: the same form as in Settings, with a required reason.
Versions
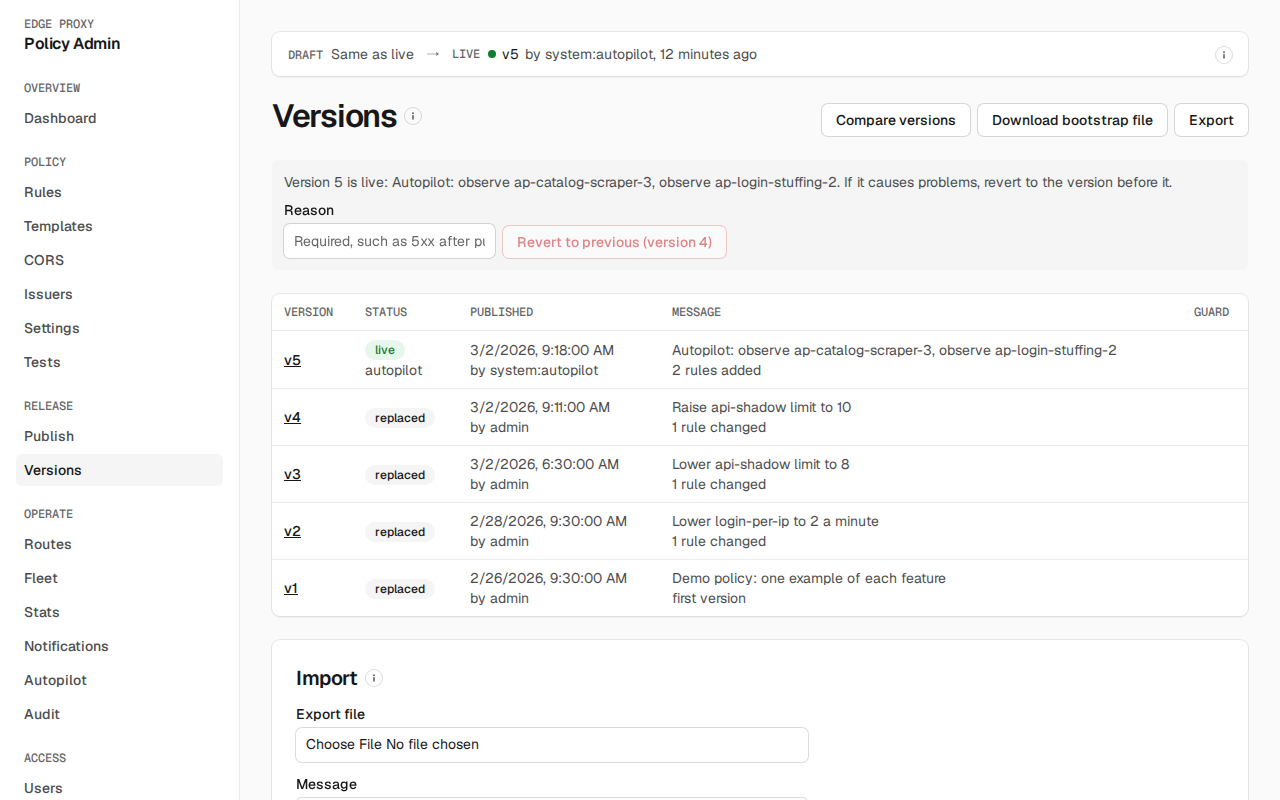
Every published version with its author, message, change summary and guard outcome. A version autopilot published is marked autopilot. An aborted canary shows its abort reason. Open one to see what it changed from the previous version and which guard signals tripped, Revert to it (a rolled back version warns that the guard never rolls back a revert) or Copy to draft; Compare versions diffs any two. A rule's published history is in its rule editor. Once there is a previous version, the banner at the top reverts to it in one step, with a reason: the emergency undo.
Download bootstrap file saves the live version as the file an edge starts from when admin is unreachable. Export saves it with its tests; Import on another admin (production, say, from staging) publishes that file through every publish check, to all traffic.
When a guard rollback, an aborted canary or a revert replaces the version a draft started from, Publish offers to rebase the draft, or, if the draft has no edits of its own, to keep the replaced version's changes in the draft to fix and publish again.
Routes
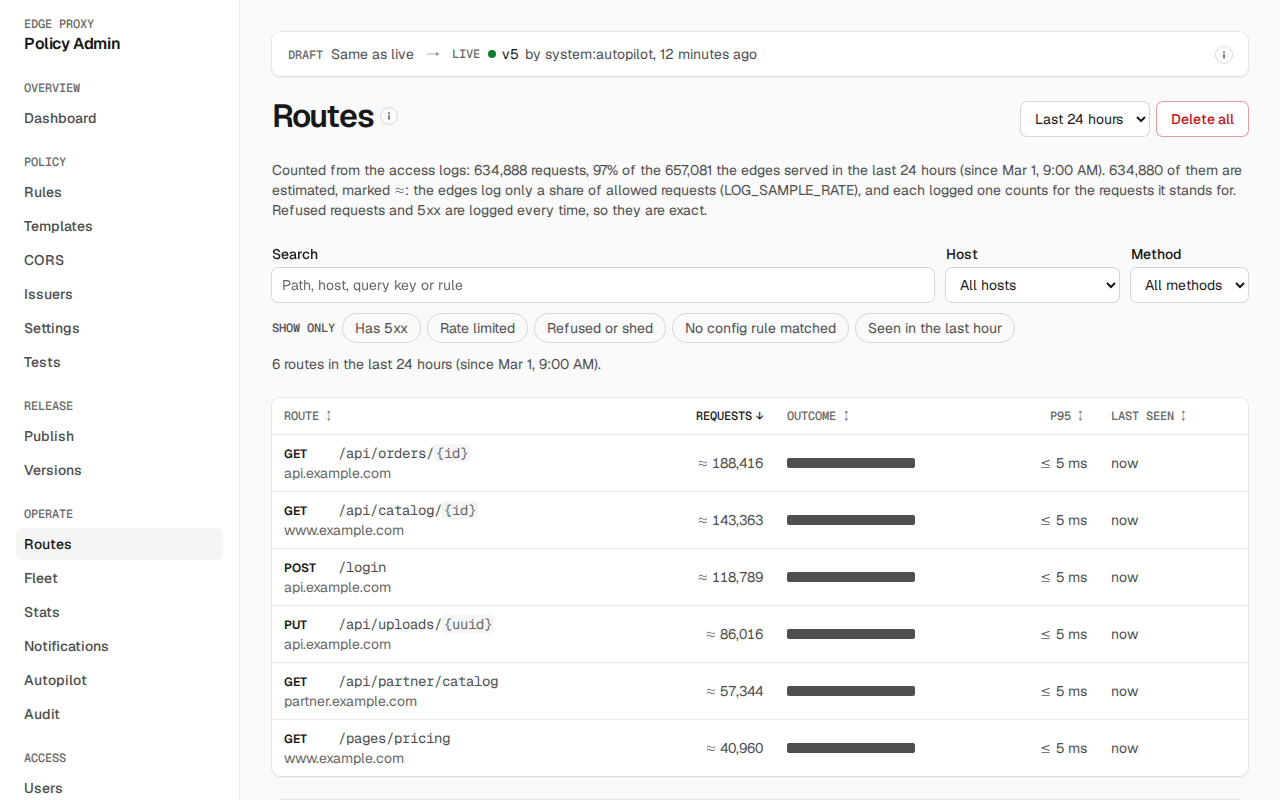
Every route the edges served, built from their access logs: a log shipper posts the logs to admin, so the edge does no extra work for this page. Without a shipper the page says no access logs have arrived; the Helm chart runs one by default, and admin's settings name its token.
A route is a host, a method and a path template. Path segments that are IDs, UUIDs, long hex strings or tokens become {id}, {uuid}, {hex} and {token}, and so do the hash and number pieces of file names such as app.3f9a1c2b7d.js. A route that has only ever been answered with errors, such as a login whose every request is rate limited, is marked only errors so far and kept under its own limit of 500, so scans for missing pages cannot push other routes out; its first 1xx to 3xx answer removes the mark and moves it under the main 5,000 limit. If that limit is full, the route keeps the mark, and its traffic that includes a 1xx to 3xx answer is counted as not grouped until there is room. Admin keeps up to 5,000 routes and 30 days of hourly counts; requests it could not group are counted on the page.
- The list shows each route with its host, its requests, an Outcome bar of the shares forwarded to the upstream, rate limited, and refused or shed (hover over it for each share and the share answered 5xx, which can come from any of them), p95 latency and when it was last seen. Outcome sorts by the 5xx share. Search matches a path, host, query argument name or rule ID; Host, Method and the Show only buttons narrow the list, and the column headers sort it. Routes are counted by the hour, so the time range covers whole hours from the time the page names, such as
in the last hour (since 8:00 AM); 30 days is the most kept. The address keeps the time range, search, filters and sort, so a view can be bookmarked or shared. - How complete the counts are: the line above the list compares the requests logged with those the edges counted. When the edges log only a sample of allowed requests (
LOG_SAMPLE_RATEbelow 1), each logged one counts for the requests it stands for, so shares match the traffic; those counts are estimates, marked ≈, while refused requests and 5xx are logged every time and stay exact. - Similar routes appears when 20 or more paths under one parent differ only in their last segment, such as blog posts. Group as one route adds a grouping, such as
/blog/*, that merges them and their history into/blog/{*}, and new paths like them join it. Under Groupings you can add one yourself, for one host or every host, where each*stands for one segment, or delete one; a more specific grouping wins over a broader one. - Delete all deletes every route and its history. Routes that still get traffic come back within a minute.
Open a route for its figures, requests per hour (per day for 7 and 30 days, the last day ending with the hour in progress) with the same release marks as the dashboard, query shapes (the sets of query argument names seen, never their values), outcomes, answers by status code (marked ≈ below 500 when allowed lines are sampled) and Upstream failures, the edge's failures to get an answer by cause, and What happens to this traffic: a request like the route's, with each placeholder filled in, walked through the edge's steps in the order the edge runs them, using the same simulation as Tests. Each rule in a step is marked Always, Never (hidden until you ask), or Depends on what decides it, such as Header x-beta or the client's country; lines starting Logged: say what the logs show happened. Above it, pick the policy to walk: Live policy, Canary (only while a canary runs), or Saved draft, which shows what a change will do to this route before you publish it.
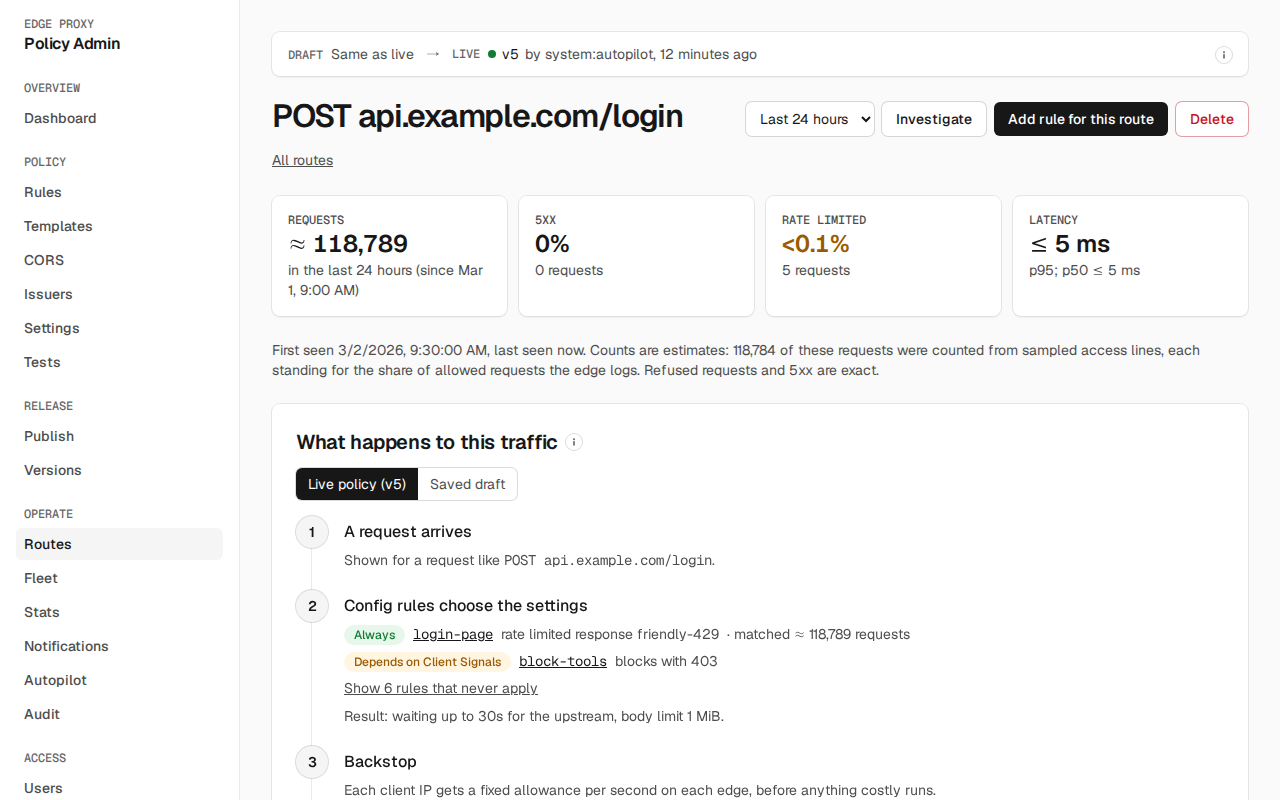
Add rule for this route opens a new config, rate limit or header rule whose condition matches the route's host, method and path. A path with a placeholder becomes a wildcard condition, and its * also matches deeper paths, so narrow it if the rule should match this route only. Investigate, with autopilot.manage, asks the autopilot about the route and opens the case. Delete deletes one route and its history. Deleting and grouping routes need the publisher or admin role, and each is recorded in the audit log.
Fleet and Stats
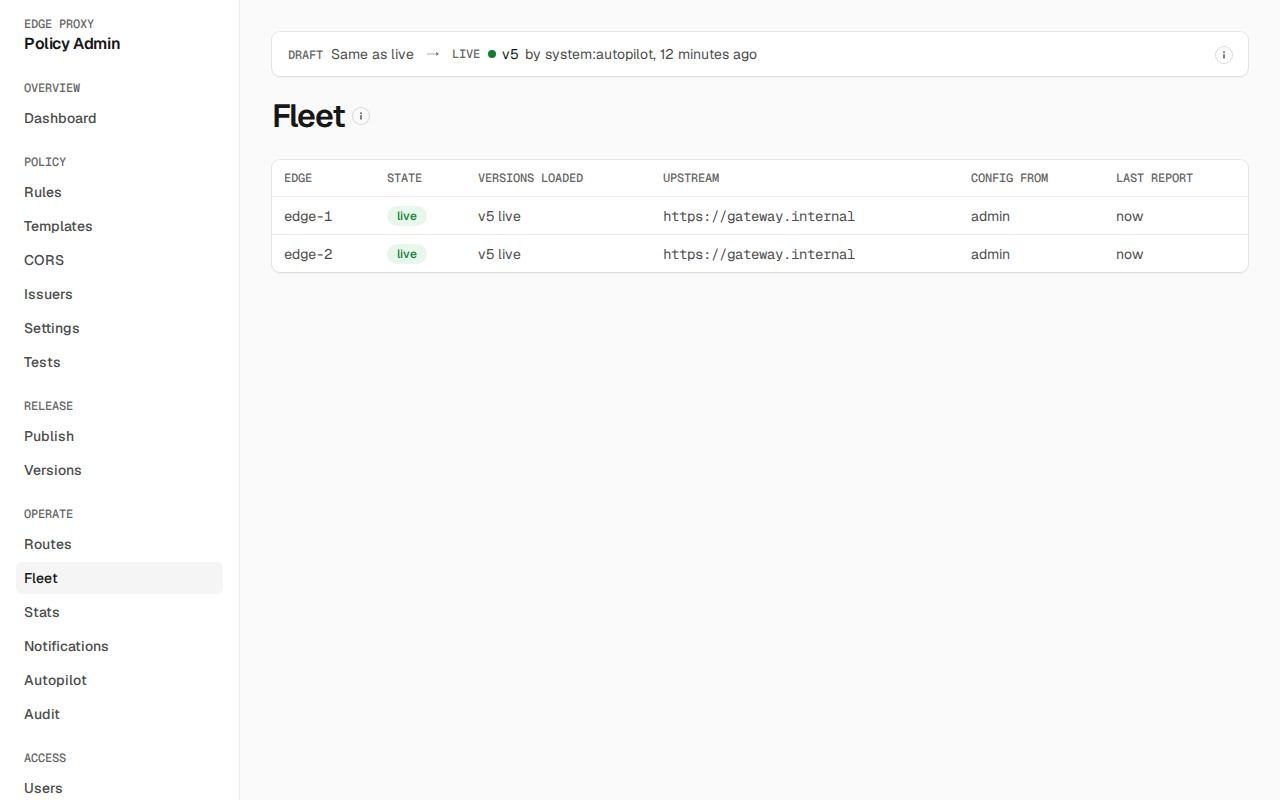
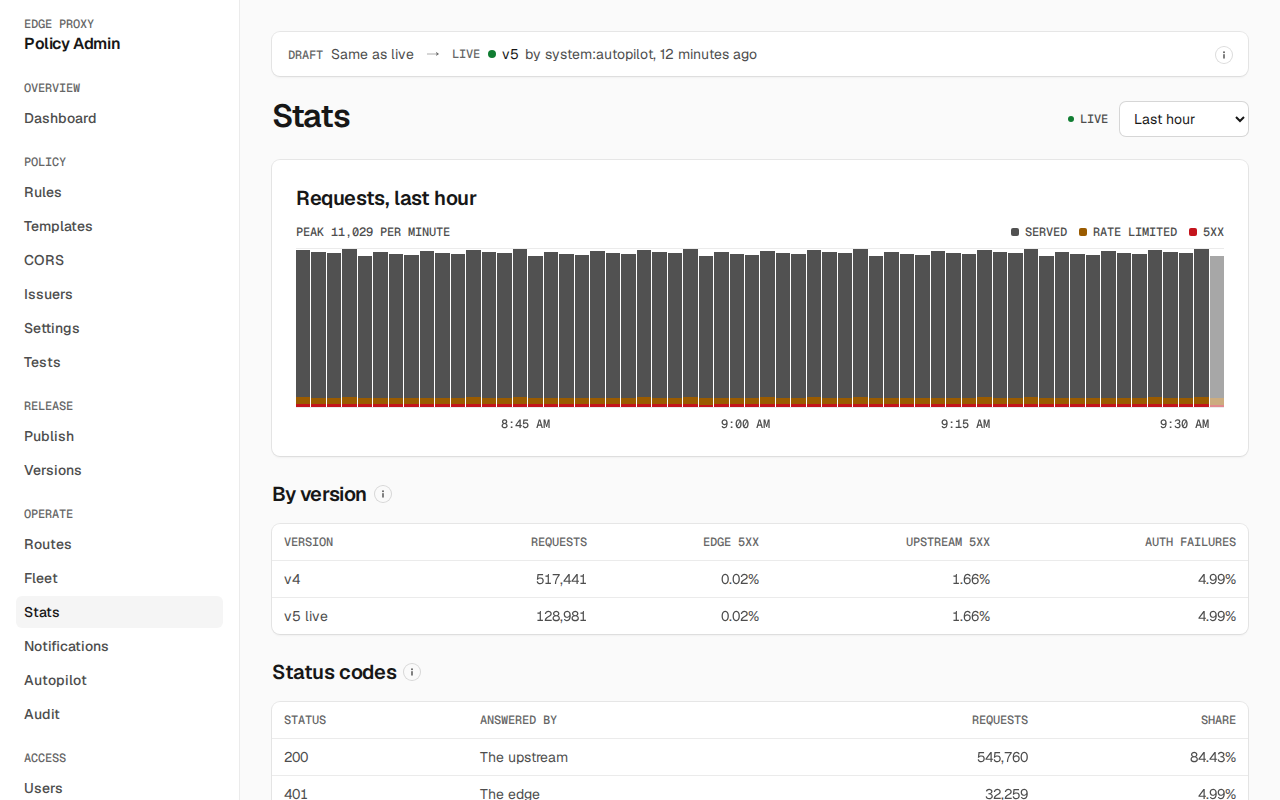
Fleet lists every edge: its state, the versions it has loaded, its upstream (the UPSTREAM_URL it forwards to, read-only because only the deployment sets it), where its config came from (admin, cache file or bootstrap) and its last report. Stats shows requests, 5xx and auth failures per version; every status code with who answered it (The edge or The upstream) and its share; Upstream failures, why the edge got no answer from the upstream (its name did not resolve, nothing accepted the connection, the upstream dropped it, the TLS handshake failed because the upstream refused it or its certificate is not valid for the request's Host or not trusted, the upstream did not connect, finish the TLS handshake or send response headers in time, or another error), each a 502 or 504 the edge sent and counted exactly; per-rule counts of every request (Checked, Blocked, Over limit, log only, and Valkey down for checks Valkey didn't answer), the config rules whose block setting decided requests (Blocking config rules: Matched, Blocked with 403, Would block, log only), plus the most-limited clients, for all rules or for the one picked in Rule. The chart zooms as on the dashboard. Each client shows its sampled estimate of requests blocked and, for log-only rules, requests over the limit, so you can see who a log-only rule would hit before switching it to block.
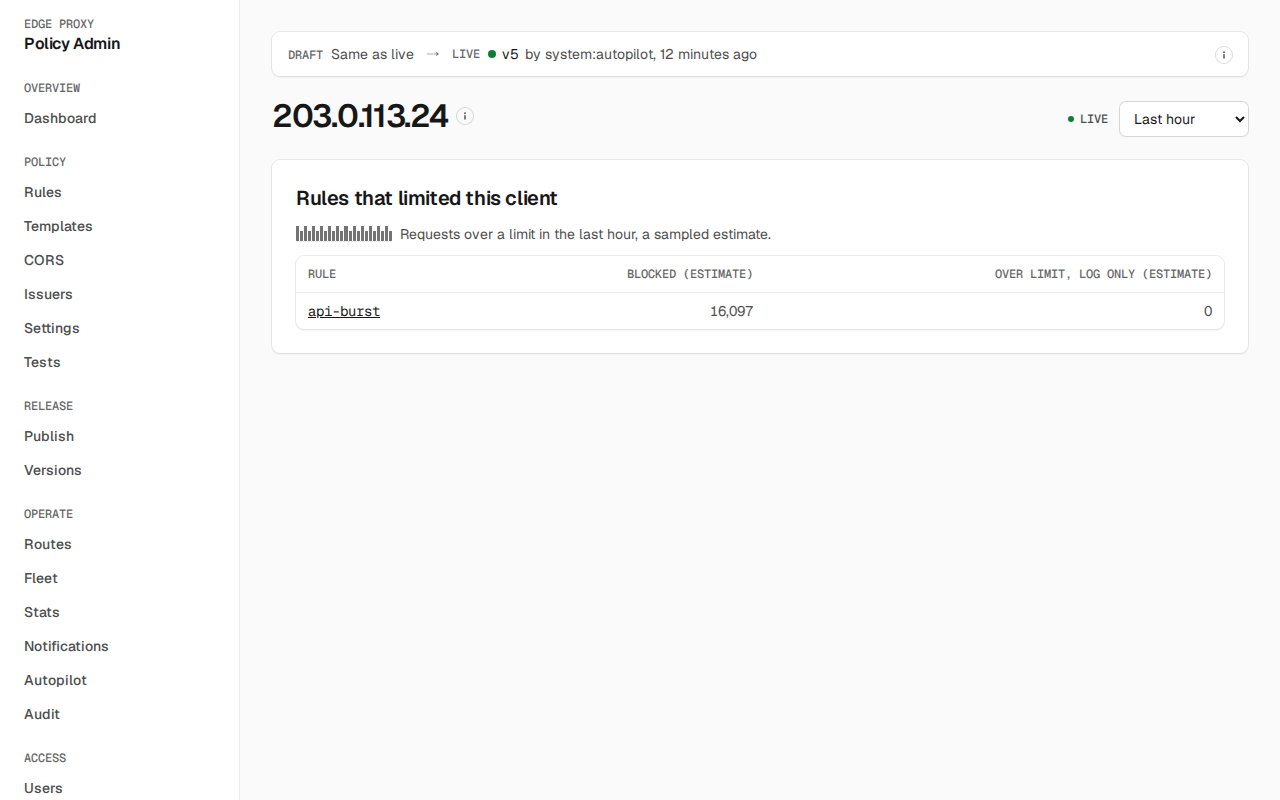
Click a client for its page, which lists the rules that limited it over the time range, with requests blocked and over the limit for each and a small chart of them. A client can also be opened from Find. Its counts come from the same ranking, so they are sampled estimates, and a client limited only a little, or among many others, can be missing.
Admin keeps counts, not access lines: the lines stay in your log store. With LOG_SEARCH_URL set (admin settings), status codes and causes on Stats, Dashboard and a route link to the matching lines there, opening in a new tab. A link is shown only where every placeholder the template uses has a value, so a template with {host} links only from a route. Edges older than this admin don't send status codes or causes, so their minutes count requests but list none.
Audit
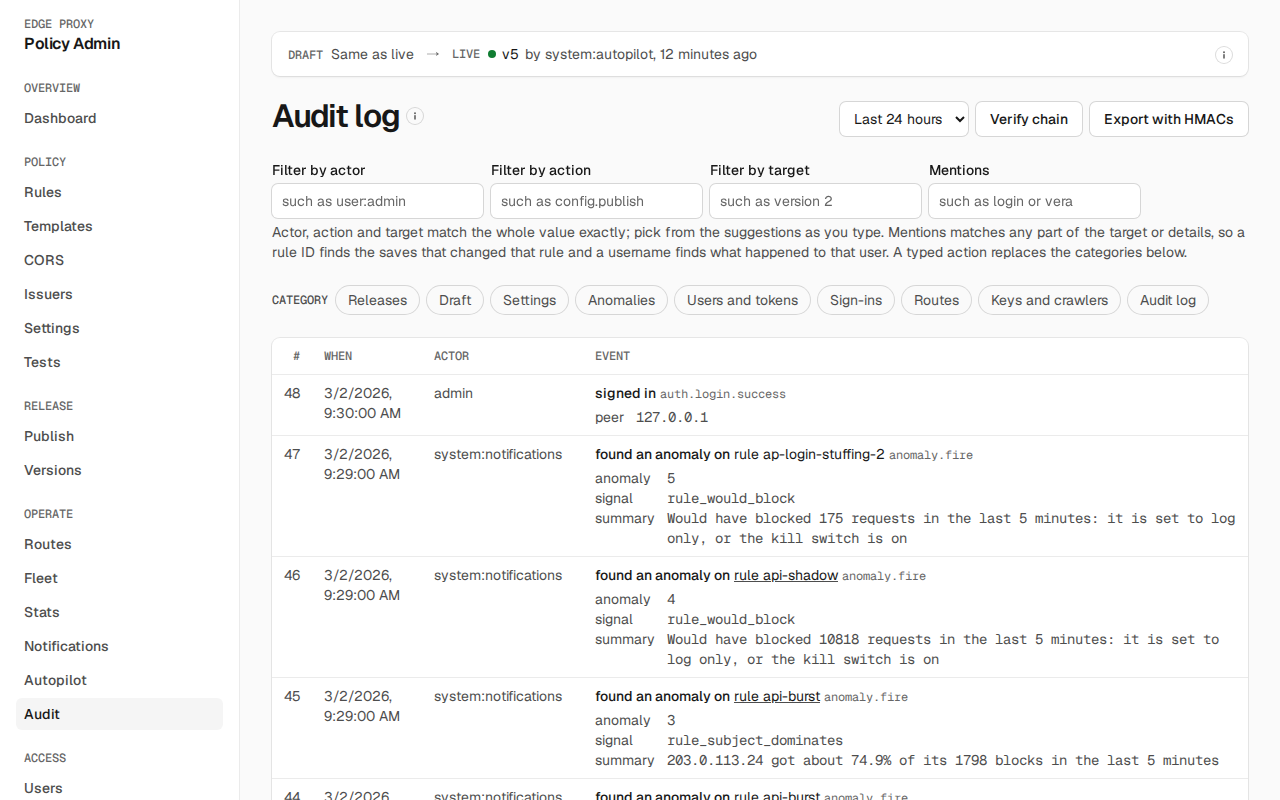
Every change, sign-in and automatic action in words, newest first, with its action name for the filter, a diff for config changes, the changed fields for a settings change, and the tripped signals of a guard event. A version, or a rule the draft still has, links to its page. It shows the events in the time range, counted back from when the page opened. Older events loads the next 100; where the range ends, a line under the list says so, and older events are in a longer range or Export with HMACs. Category narrows it to one or more kinds of event: releases, draft, settings, anomalies, users and tokens, sign-ins, routes, keys and crawlers, or the audit log itself. Filter by actor, action or target, which match exactly, or by Mentions, which finds any part of the target or details: a rule ID such as login finds the saves that changed it, and a username finds what happened to that user. A typed action replaces the categories. Export with HMACs, and check the integrity badge: it shows whether the last recorded verification of the HMAC chain (daily, manual, or a detected break) passed.
Users
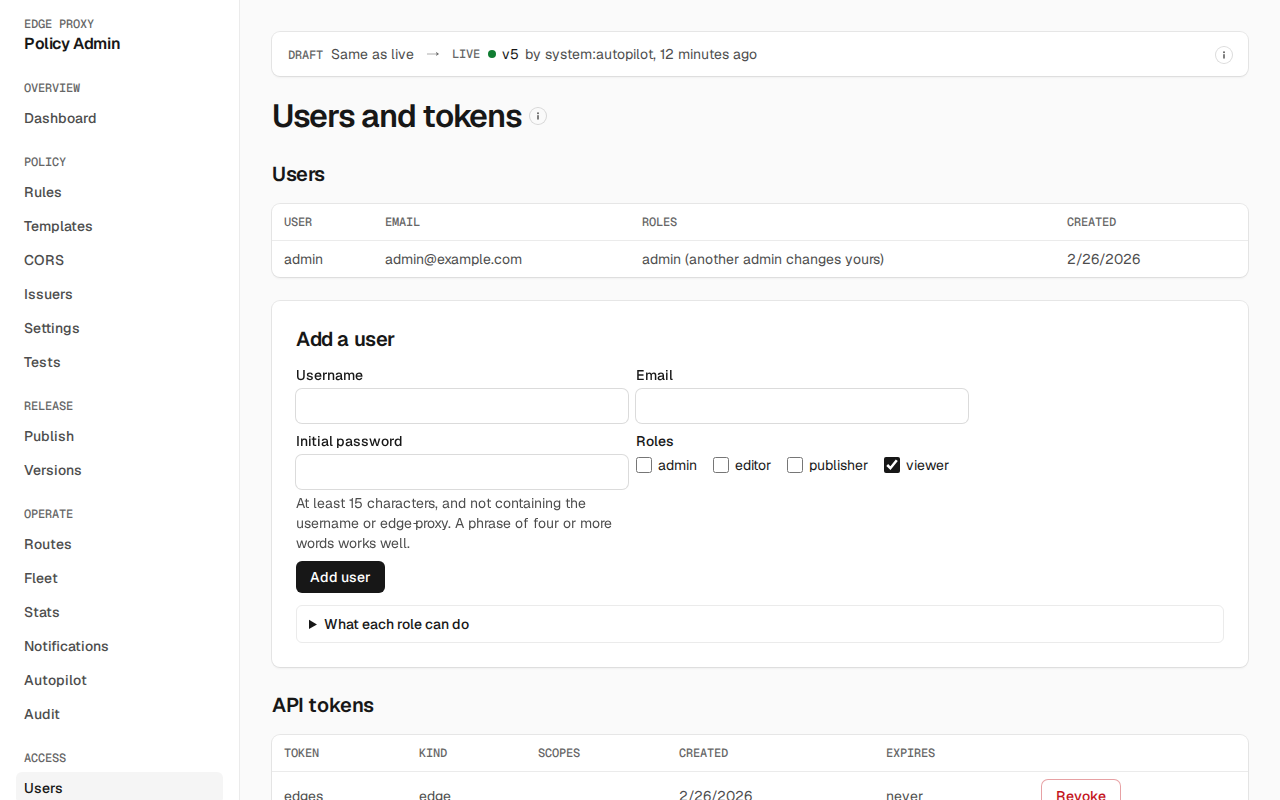
Add users, set their roles and disable them; your own roles and account are changed by another admin. A change that would leave no enabled user who can manage users is refused. Create tokens here too:
- edge tokens, which edges use to fetch config and send stats;
- user tokens with scopes picked from the permissions you hold, for automation.
A token is shown once, when it is created.
Account
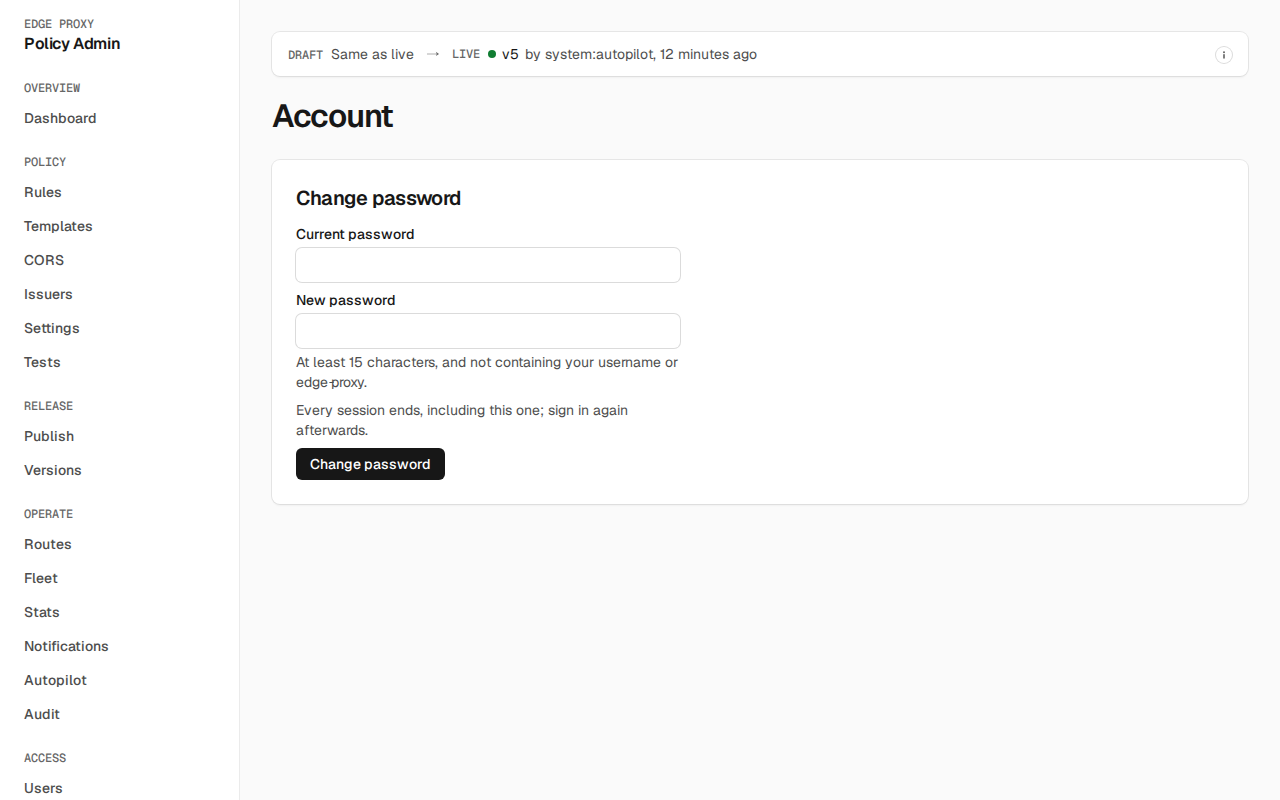
Change your own password. Passwords are hashed with Argon2id and checked against the optional blocklist (PASSWORD_BLOCKLIST_PATH); sign-in attempts are throttled.