Backtest
A backtest replays the profile's strategy over historical candles so you can judge a config before it trades real money. Open it from the profile's Backtest section. The screen has three sub-tabs — Configure, Results, and Past runs.
For what the engine actually does, and why a backtest reads optimistic relative to live trading, see Backtesting; for what each metric means, see Backtest metrics.
Configure

The Configure tab: pick a window, tune the config, and run. Seeded demo data, not a real account.
The Backtest section opens on its Configure sub-tab, where you set the window, costs, and strategy config, then run.
- Quick window (ending now) — preset buttons
30d·90d·6m·1y, or set From / To by hand. Arriving with no window set pre-fills the last 1 year — whether you followed a symbol page's Backtest link or opened the Backtest section directly; adjust it or pick a preset before running. A shared or auto-run link keeps its own window. - Detail interval — finer candles used to simulate price movement inside each strategy candle, for more realistic fills. Must be the same as or finer than the strategy's Candle Interval.
- Advanced — fees, slippage & realism (collapsible) — the cost model:
| Field | Meaning |
|---|---|
| Starting balance (quote) | Quote currency (e.g. USDT) the simulated run starts with. |
| Slippage (bps) | Price slippage per fill, in basis points (1 bps = 0.01%). |
| Maker fee (bps) | Fee on orders that add liquidity (resting limit orders). |
| Taker fee (bps) | Fee on orders that take liquidity (market orders). |
| Spread (bps) | Bid/ask spread charged on every fill, so even limit fills are not free. |
| Max fill per candle (% volume) | Cap on how much of a candle's volume one order may take, so a large order cannot fill instantly on a thin candle. Blank disables. |
- Strategy config — prefilled from the profile's live config. Edit any field to test a different setup; the run uses these values, not the saved config. Reset to current live config discards your edits. Your live config is unchanged until you apply a result.
Press Run backtest.
Results
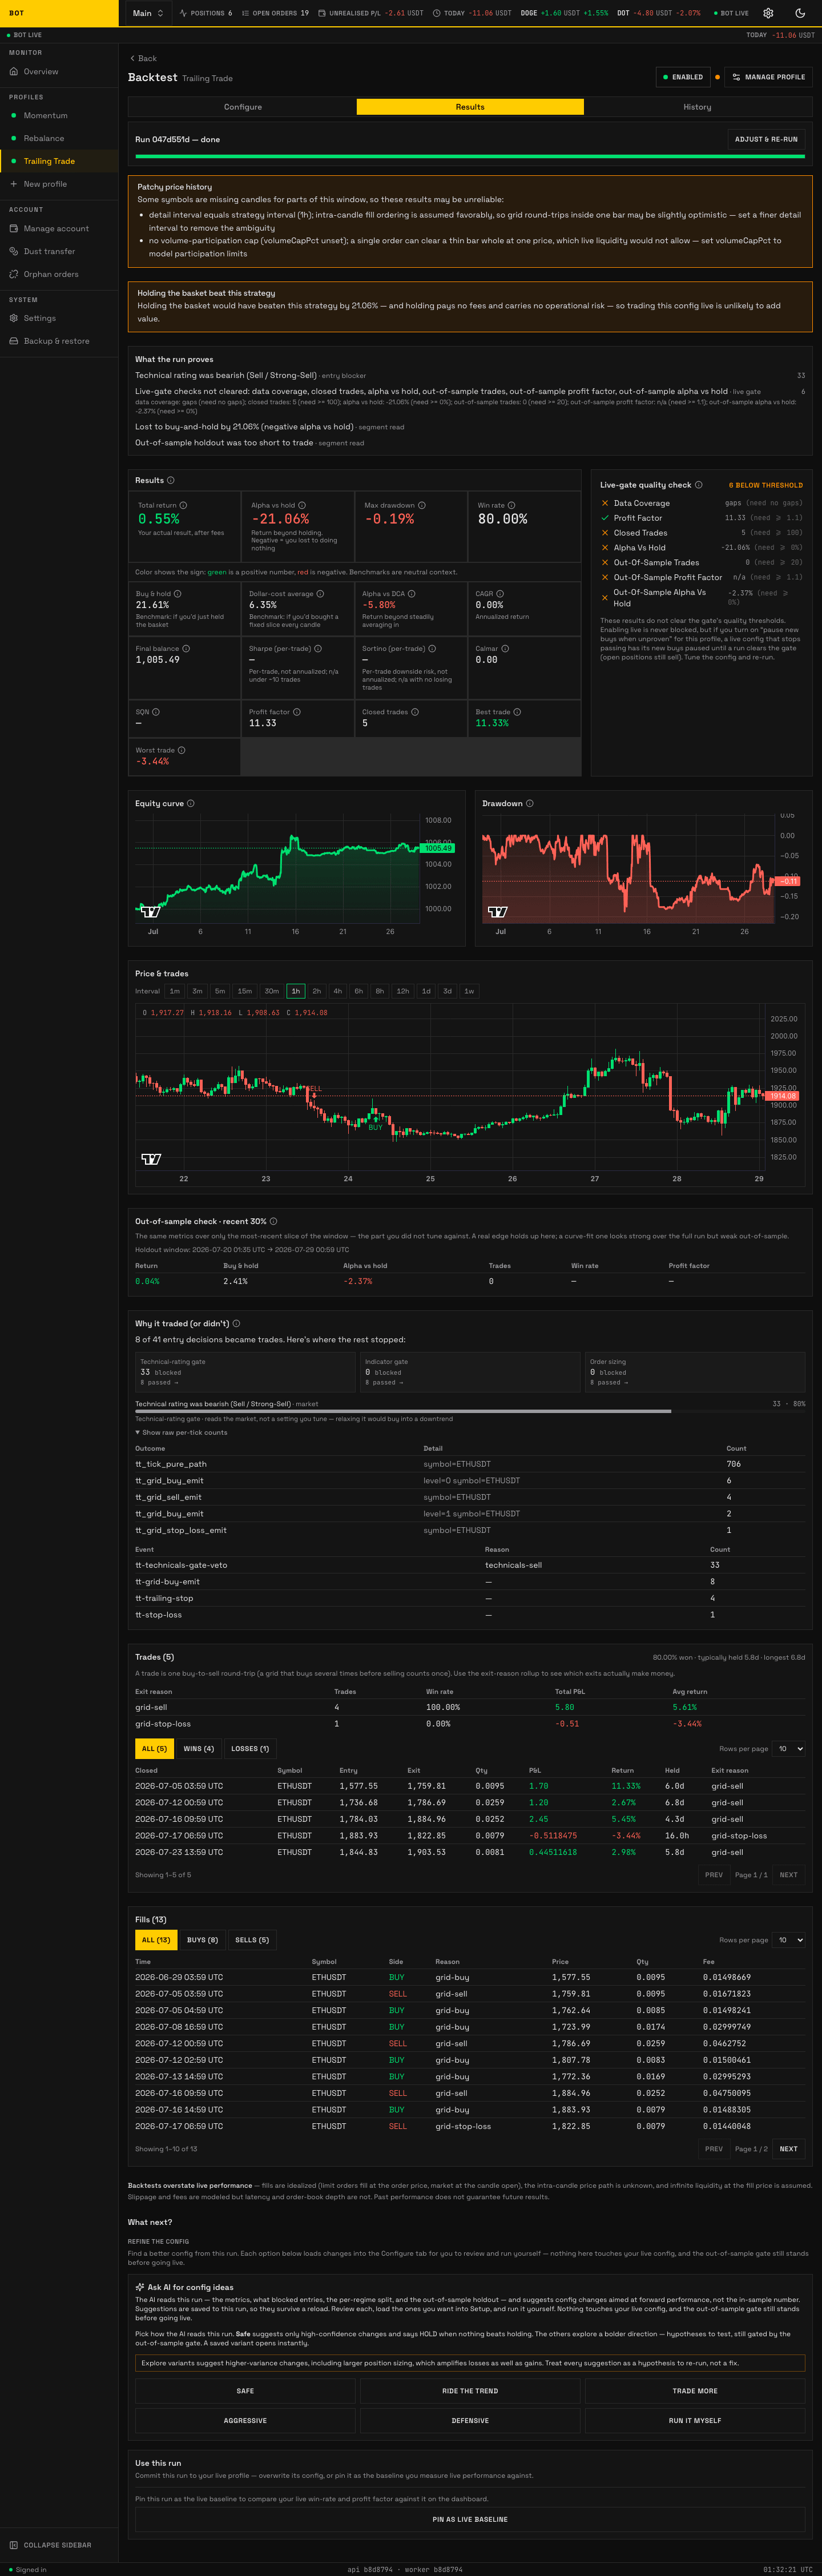
The Results tab: headline tiles, the full metric set, charts, and round-trips. Seeded demo data, not a real account.
The run header names the run by the first eight characters of its id and, under that, Run at — the moment you launched it. The id says which run, never when, so a re-run is otherwise indistinguishable from the run it replaced. A progress bar tracks a run only while it is queued or running; once it finishes the bar goes away, so a bar on screen always means work still in flight. The Results section leads with four tiles — Total return (your actual result after fees), Alpha vs hold (return beyond just holding; negative means you lost to doing nothing), Max drawdown, and Win rate — then the full metric set (Buy & hold, Dollar-cost average, Alpha vs DCA, CAGR, Final balance, Sharpe, Sortino, Calmar, SQN, Profit factor, Closed trades, Best/Worst trade), the price and equity charts, and the round-trip and fill tables. Green is positive, red is negative; benchmarks are neutral context. An advisor can summarise the outcome and suggest changes. The Backtest metrics reference glosses each ratio.
If a Live gate policy is set, a Live-gate quality check scorecard shows beside the results so you can see whether this run clears your bars.
Past runs
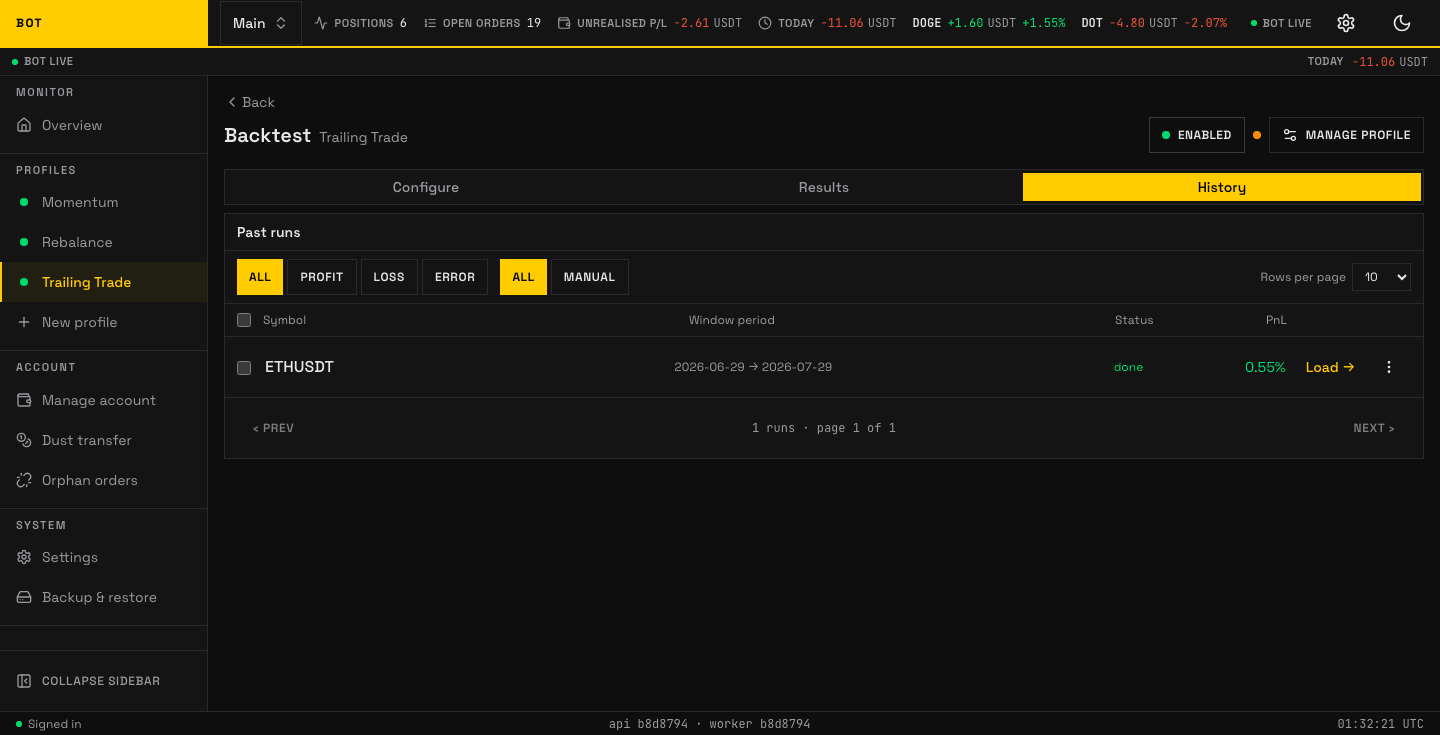
The Past runs tab: every past run, ready to reopen or compare. Seeded demo data, not a real account.
Every past run for the profile. Reopen one to load it into Results, or compare two. Each row shows two different times and you need both: Window period is the stretch of market history that run replayed, and Run at is when you launched it. Reading one as the other is the confusion the Run at column exists to remove — two runs of the same coin over the same window are otherwise indistinguishable on the row.
Each row carries a Config code: a short fingerprint of the settings that run actually executed. Two runs over the same window with the same code tested the same configuration, so a difference in their results came from somewhere else; two different codes are the A/B you were trying to read. A run that has not finished shows a dash instead, because the fingerprint is taken from the config that ran, not the one that was queued. The code shown is the first eight characters; on a desktop browser, resting the pointer on it reveals the full value.