History
The History section is read-only: it shows what the profile has done. It has four views (the "History view" tabs): Archive, Audit, Logs, and Activity.
Audit and Logs answer different questions and stay separate. Audit is what you changed — a handful of rows a day. Logs is what the bot did and why — the worker's own record, at much higher volume.
Archive
Completed trades with their profit and loss, read top to bottom: the verdict for the period, the curve that produced it, where the edge came from, then the trades themselves. Controls:
- Period —
All time,Today,This week,This month, orCustom. Everything on the page is scoped to it, including the curve and both summaries. Custom opens a From and a To date; either may be left blank for an open end, and the window it resolved to is stated under the two fields so there is never a doubt about which days were counted. Dates are whole days, cut the same way the four presets cut theirs. From after To is not applied, and says so rather than emptying the list. - P/L basis toggle — Net of all fees or Recorded, with a one-line gloss of what the selected basis means. Recorded uses the stored cost-basis result; Net also applies fees not already included there. A Net figure is reported whenever at least one trade behind it could be valued, and withheld only when none of them could; where some were left out, the number of cycles it covers is stated beside it.
- Recover a specific coin — a collapsed section for a coin that is missing from the list below and from the notices above it (enter e.g.
WLDUSDT, press Backfill); reconstructed trades appear shortly. Safe to re-run, and the coin need not still be trading.
The verdict, at the top, is one block per quote coin: what the period made, over how many trades, how often it won, what an average trade was worth, and how much of the gross the commission took. The tiles summarise the period; the detailed trades appear below the curve and edge summaries. A figure that fee evidence cannot support is withheld there too rather than estimated. When the period holds trades whose commission could not be read, the Net tile carries the coverage under it — 12 of 15 cycles — because the Trades tile beside it counts every trade in the period, and the two are not the same denominator.
The curve plots cumulative P/L for the period against holding the benchmark coin instead, so a rising line in a rising market can be told apart from an edge. The benchmark is chosen beside the chart. Marks on the time axis are the config changes you made inside the window — the ones that can explain a bend — not every action the bot took. A window holding more changes than the chart can read says so under the curve rather than naming a count it did not plot.
Where the edge is — the same two summaries as before, P/L by exit reason and P/L by source, now as a sortable grid on a wide screen: trades, win rate, net, expectancy per trade and average hold. A bucket whose fee evidence covers only some of its trades states that coverage on the line — 12 of 15 cycles — so the trade count at the head of the line is never read as the denominator behind the ratios. Click a column heading to order by it (largest first, click again to reverse); the arrow and the announced sort order say which one is active. Click a row to narrow the trades below to that bucket. Below md the same buckets stay the two-line cards they were.
The trades. A chip above the list names the filter in force — an exit reason, a source, a coin — with Clear beside it; the empty state names it too, so "no trades" can never be mistaken for "this profile never traded". Export these trades downloads exactly the selection on screen (the period, the filter and the ordering), one JSON object per line.
Columns: Symbol · Exit · Buy · Sell · Net P/L (or Recorded P/L) · P/L% · Fees (commission paid to Binance) · Held · Time · row actions. Symbol, the P/L column, Held and Time are sortable headings, and they order the whole period rather than the page you are on. Held is the gap between the cycle's first buy and the sell that closed it; a trade rebuilt from Binance history carries no open time, so it reads — and sorts last in either direction rather than counting as an instant trade. A cycle whose two stamps run backwards reads the same way: the stamps cannot both belong to it, so it is untimed rather than the fastest trade in the list. P/L% uses the same basis as the amount beside it, so both change together. When the selected basis is available, the % of P/L shares in each summary — P/L by exit reason and P/L by source — add up to 100 for one quote coin (the coin you spend, e.g. USDT) whenever that coin has any P/L. The two summaries are counted separately, so their percentages are not meant to be added together; an all-zero line in either summary shows 0%. If the period covers trades priced in more than one quote coin, each share names its own coin — 25% of USDT P/L — because each coin is counted to 100 on its own and the lines are not shares of one shared total. With a single coin the shares stay the plain % of P/L. A line that could value none of its cycles shows net n/a in place of its share instead of a 0% that would claim it contributed nothing; a screen reader reads that mark as Share of P/L unavailable, fee evidence missing for every cycle in this
On a phone those columns will not fit, so each trade becomes a two-line row instead: the coin and its profit or loss on the first line, why it closed and when on the second. Tap a row to open a panel with the full figures — Buy, Sell, P/L, P/L%, fees, how long it was held and the archived time. On a wide screen the same panel opens from View details in the row's ⋮ menu, which is otherwise the same actions menu as before, Delete included. Nothing is dropped by the narrower layout; it is the same trades, one tap deeper.
The panel also carries the two things only it fetches: Orders in this trade — each buy and sell with its intent, status and quote amount — and What you changed while it was open, the audit entries inside that trade's own window — with a line at the end of the list if the window held more than it read. A trade rebuilt from Binance history has neither an open time nor recorded orders, and the panel says so instead of showing an empty list.
When history is incomplete
Two notices can appear above the trades, and they mean different things.
- Trade history incomplete (a yellow warning) — these coins have fills on Binance but no saved profit/loss here. While the profile is running, the bot retries them by itself every 15 minutes, so they usually clear without you doing anything. A paused profile is not swept, so nothing retries until you resume it — press Recover all to repair it now, and press it any time you would rather not wait for the next pass.
- A quieter grey note lists coins a recovery already tried and could not rebuild, each with its reason: no closed buy → sell cycle yet, sold without a recorded buy, sold more than was bought here, or Binance no longer lists the coin. There is nothing to do about those, so there is no button — ✕ hides one and Show hidden brings it back.
A trade can read n/a in place of its profit or loss, with an em-dash where the percentage would be — in the P/L% column on a wide screen, in the tap-to-open panel on a phone. A plain n/a means the bot has no record of what the coin originally cost, so it cannot work out the profit or loss. It is the only mark that means unrecoverable history: a P/L amount withheld for incomplete fee evidence reads net n/a instead. Other things that fault withholds read differently, so do not read them as empty: the P/L% cell shows an em dash, and a summary line that could value none of its cycles drops every fee-derived figure — win rate included, since a cycle counts as a win by clearing its fees — keeping only its trade count and the words fees not accounted. A screen reader reads that mark as P/L unavailable. On those rows the Buy and Sell figures count only the part it could match, so they read low too, and the summaries above count the trade as zero. It is an unmeasured trade, not a break-even one.
A row marked net n/a is the other fault: the fee evidence is incomplete, so only the Net figure is withheld. A screen reader reads that mark as Net P/L unavailable. Recorded P/L and raw Fees remain visible. The summaries and the verdict above still report their Net figures and statistics over the trades they could value, with that coverage stated beside them — 12 of 15 cycles — and withhold outright only where nothing in the bucket could be valued at all. Zero alone does not prove completeness because a BUY fee already included in cost basis can require no additional adjustment.
Audit
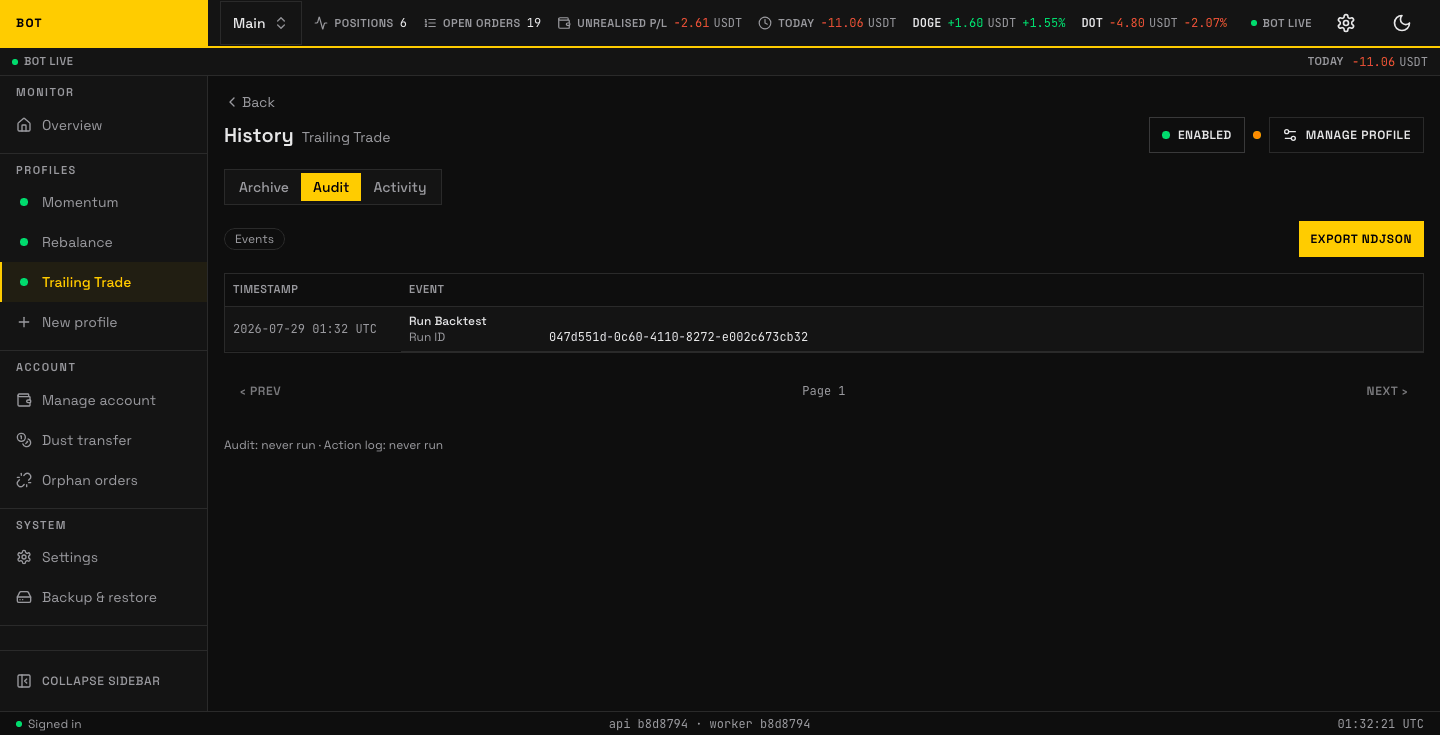
The Audit view: every event the profile emitted, filterable and exportable. Seeded demo data, not a real account.
Every event the profile emitted, for tracing exactly what happened and why.
- Events filter across categories: Orders, Profile, Symbols, Position.
- Export NDJSON downloads the complete audit log regardless of the filter.
- Columns: Timestamp · Event.
Logs
Why the bot acted, or why it did not. Each row is one thing the worker decided, with the structured context it recorded at the time — order ids, prices, the reason Binance rejected something. Expand Context on a row to see that context as raw JSON.
Filters — level chips (debug, info, warn, error), a symbol list, a time range (1h, 6h, 24h, 7d, All, opening on 24h), and a message search applied when you press Search.
Getting the rows out:
- Copy on a row copies that one row as JSON.
- Copy page copies every row currently on screen.
- Export NDJSON downloads every row matching the current filter — not just the page, and not the unfiltered log. One JSON object per line, with the full context intact. One export stops at 500,000 rows; if there were more, the last line is
{"truncated":true,...}instead of a log row. A capture window can pass that, so check the last line before treating a file as the whole record, and narrow the time range if it is there.
Capture every tick. By default the bot logs when something changes. When that is not enough, pick a duration (15m, 1h, 4h, 24h) and press Capture every tick: every tick of this profile is written as a debug row until the window lapses on its own. It is a large amount of data, so the window is always bounded, and only one profile can be captured at a time — if another one is armed, the panel says so rather than silently taking over.
Raw tick trace
Below the log list, collapsed until you open it. This is a direct window onto the stream the worker already writes on every tick, so it costs no storage and needs nothing armed in advance — but it is trimmed by entry count, not by age, so on a busy profile it reaches back hours rather than days. Payloads are shown unprojected: whatever the strategy recorded is what you see. When you need a window that outlives the buffer, arm capture instead of enlarging it.
How long log rows are kept, and how many trace entries are held, are set in Settings → Log retention.
Activity
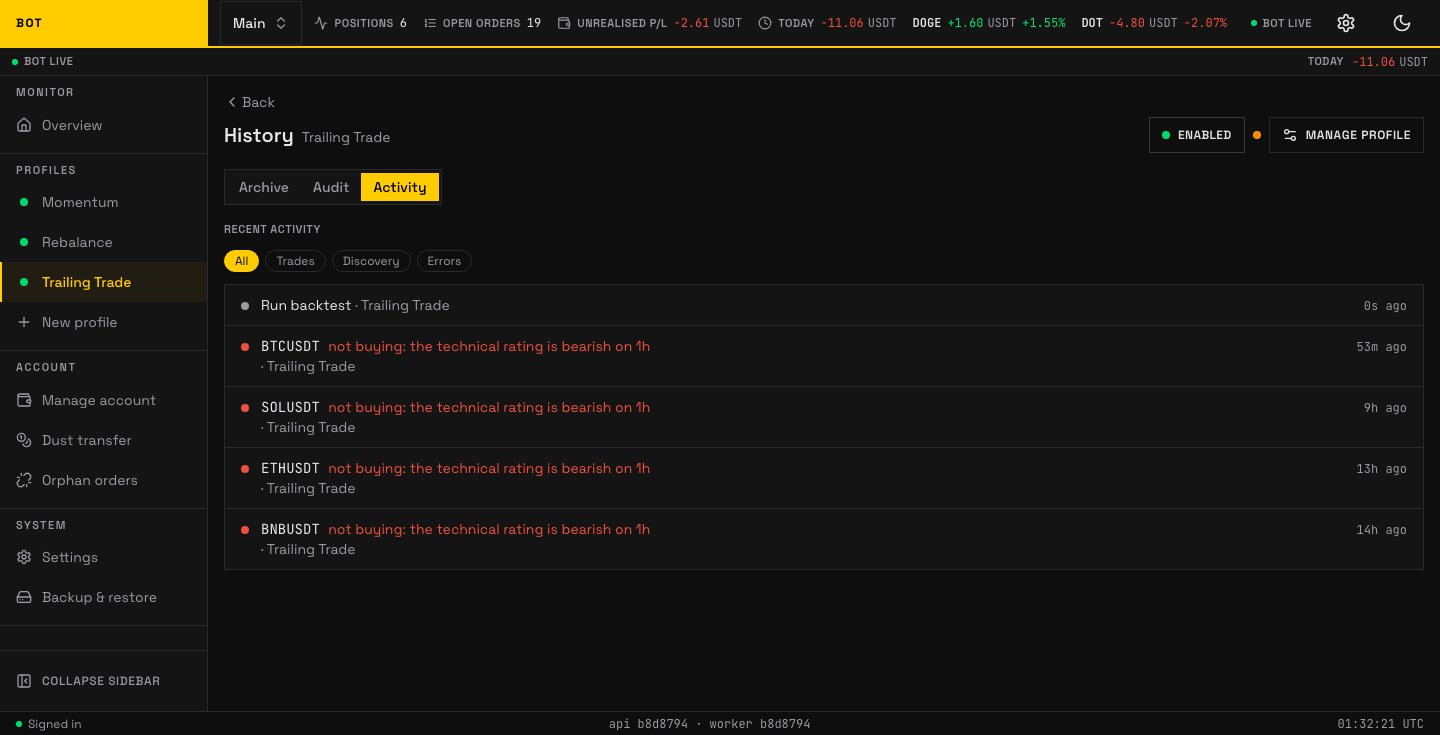
The Activity view: a merged, dashboard-style feed of recent events. Seeded demo data, not a real account.
A merged, dashboard-style feed of recent events for the profile.
Reconcile fees
If a row or a summary line is marked net n/a, run Reconcile fees; a summary can carry the mark when the incomplete trade is not on the page you are looking at, because the summaries cover the whole period while the list is paged. see Profile settings → Reconcile fees.