Grafana
Grafana gives the platform its own aggregated state: alerting, dashboards, and annotations across every backend it sits in front of.
It deliberately stops there. Raw metrics and logs come from the Prometheus and Datadog connectors, and this connector never reaches through Grafana to a data source behind it.
What it adds to an investigation
The dotted line is the point of the connector. See Why it stops at Grafana.
How it is wired
flowchart LR
    Inc["An investigation<br/>needs evidence"] --> Tools["Read-only tools"]
    Tools --> Graf["Grafana"]
    Graf --> Scrub["Result scrubbed<br/>of secrets"]
    Scrub --> Thread["Evidence in the<br/>incident thread"]
    Graf -.->|"refused"| Source["The data sources<br/>behind Grafana"]
One path, and it stops at Grafana. Nothing is polled and nothing is pushed, so between incidents the platform sends Grafana no traffic. The dotted edge is deliberate and explained in Why it stops at Grafana.
Before you start
| You need | Why |
|---|---|
| Your Grafana address, self-hosted or Grafana Cloud | A private network address is allowed |
| A service account token with the Viewer role | That is Grafana's first-class API authentication |
| Your certificate authority, for a self-signed certificate | Otherwise you must explicitly skip verification |
Legacy API keys are deprecated, and basic authentication is a login-form mechanism rather than an API one. Viewer is enough.
Connect it
Open Connections, choose Add connection, then Add Grafana. Four steps. The catalog and the shape every wizard shares are in Set up a connector.
1. Connection
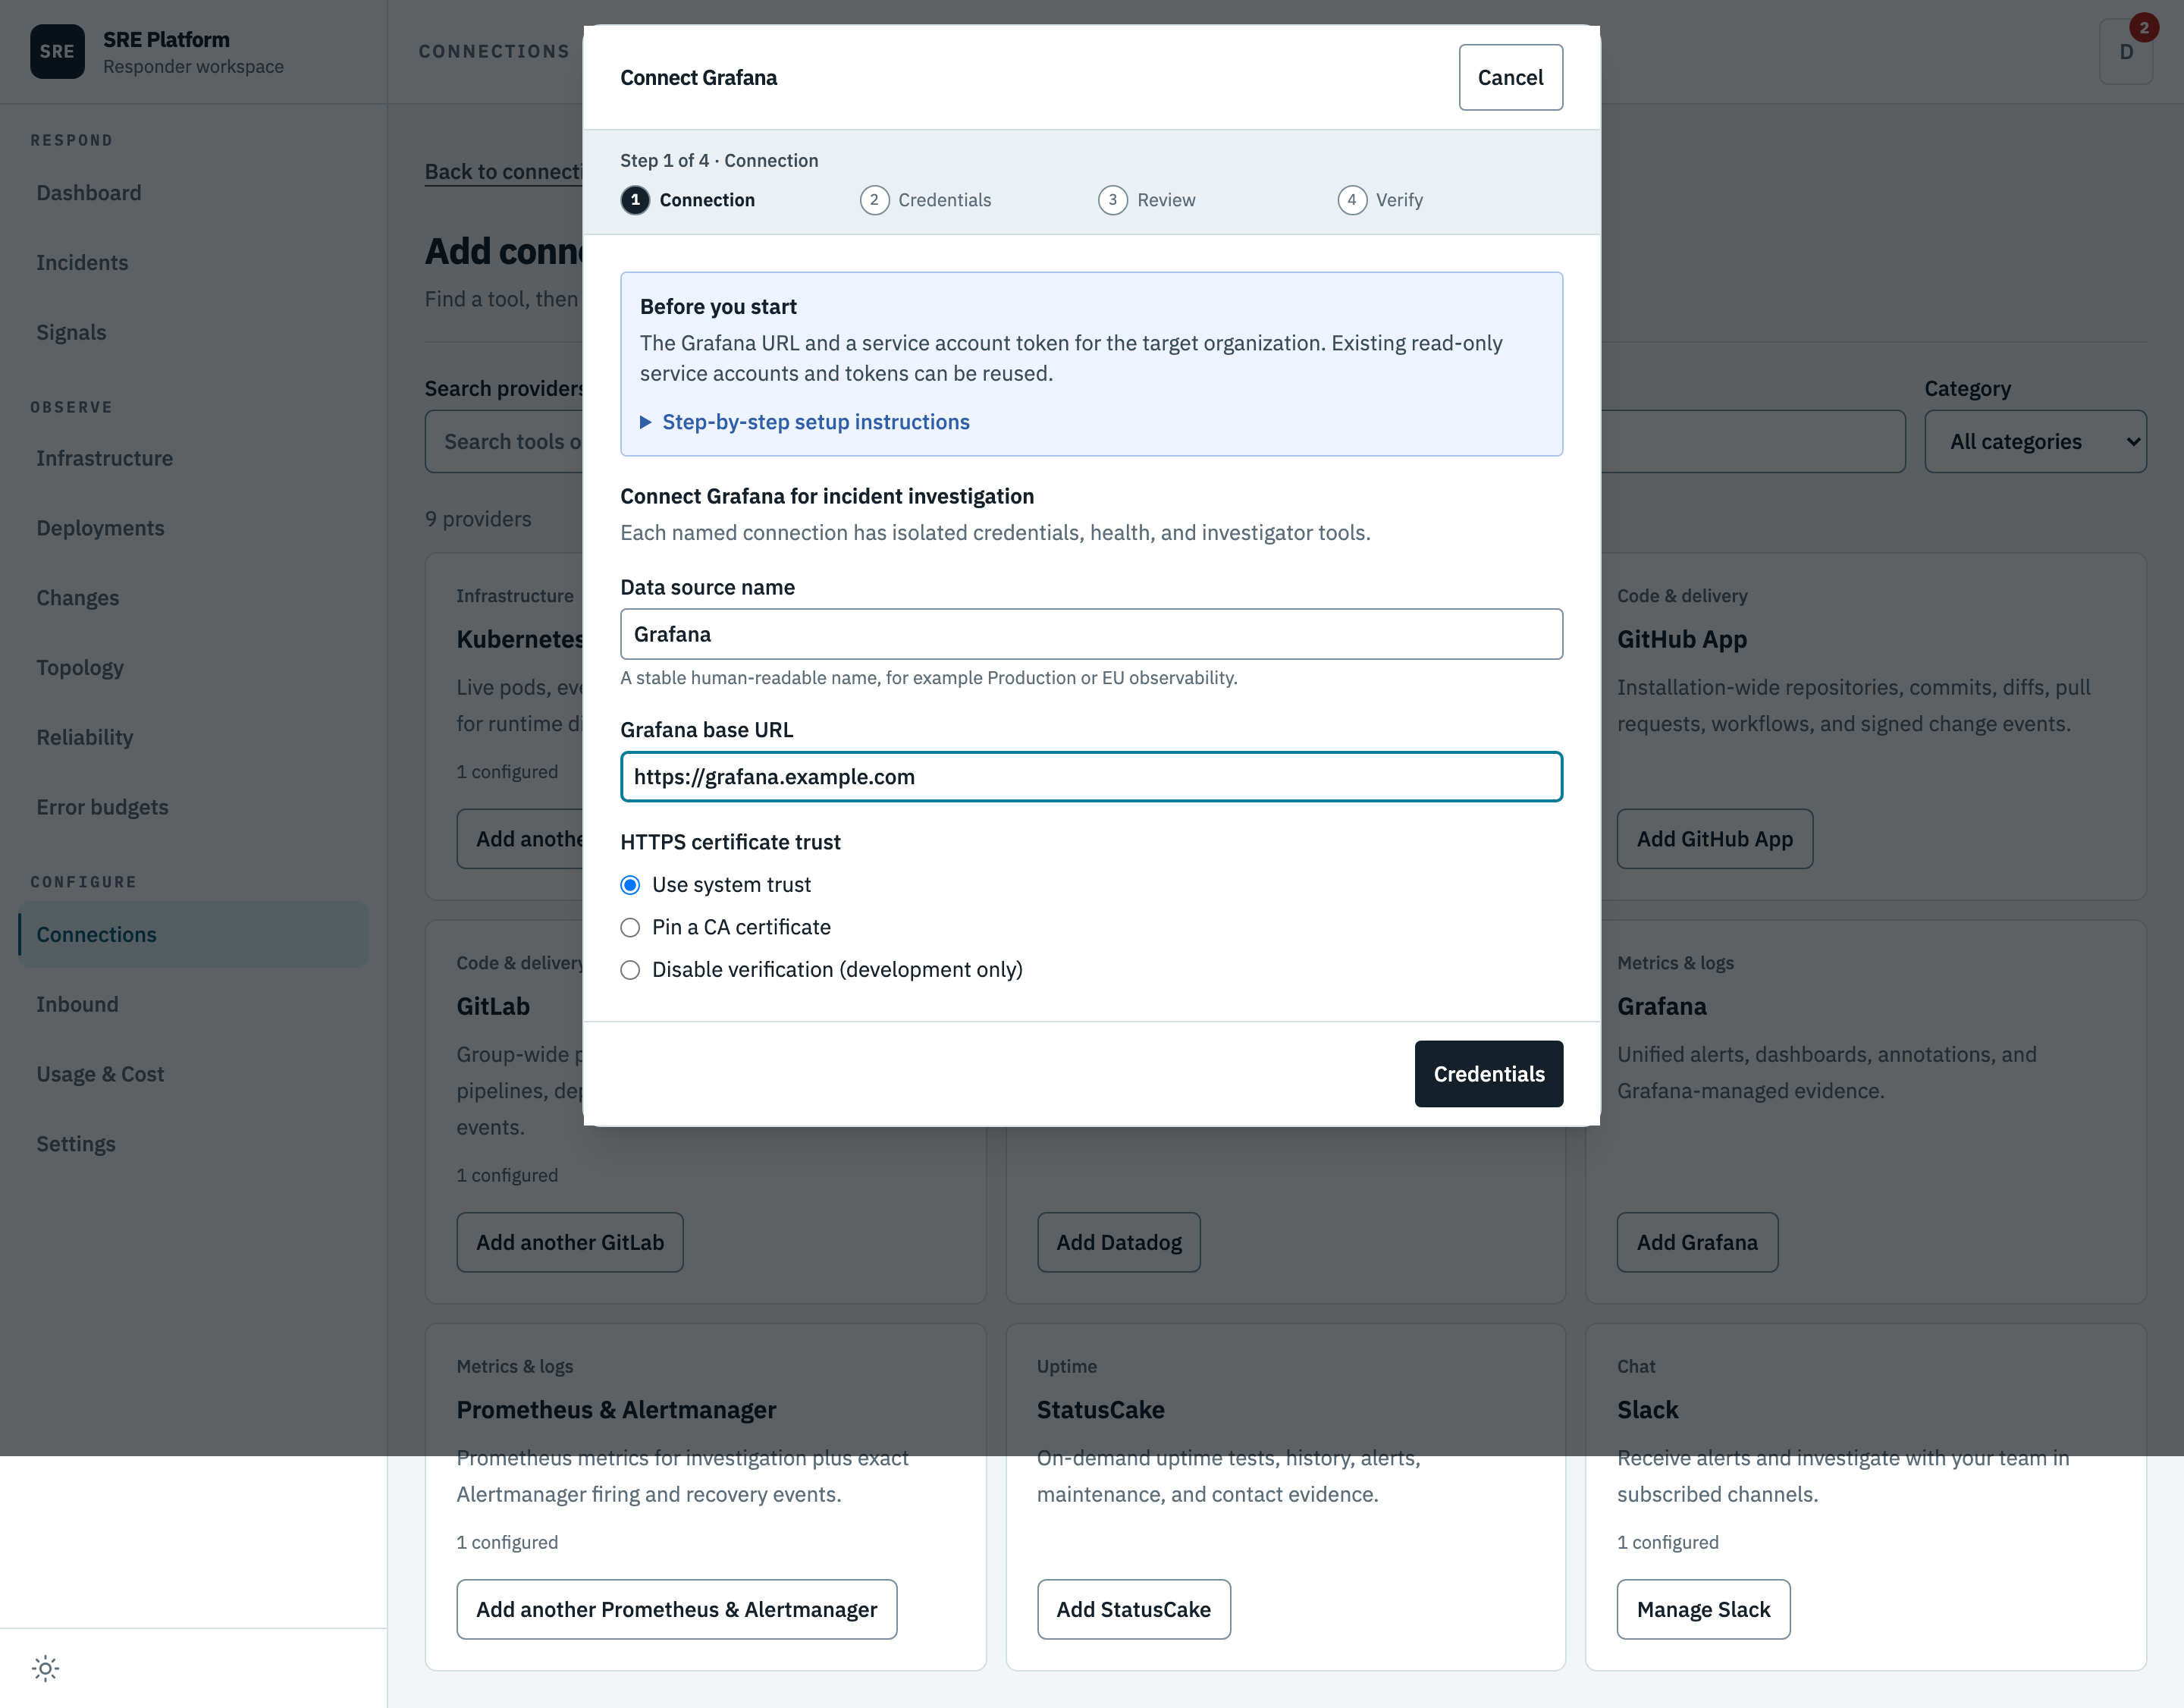
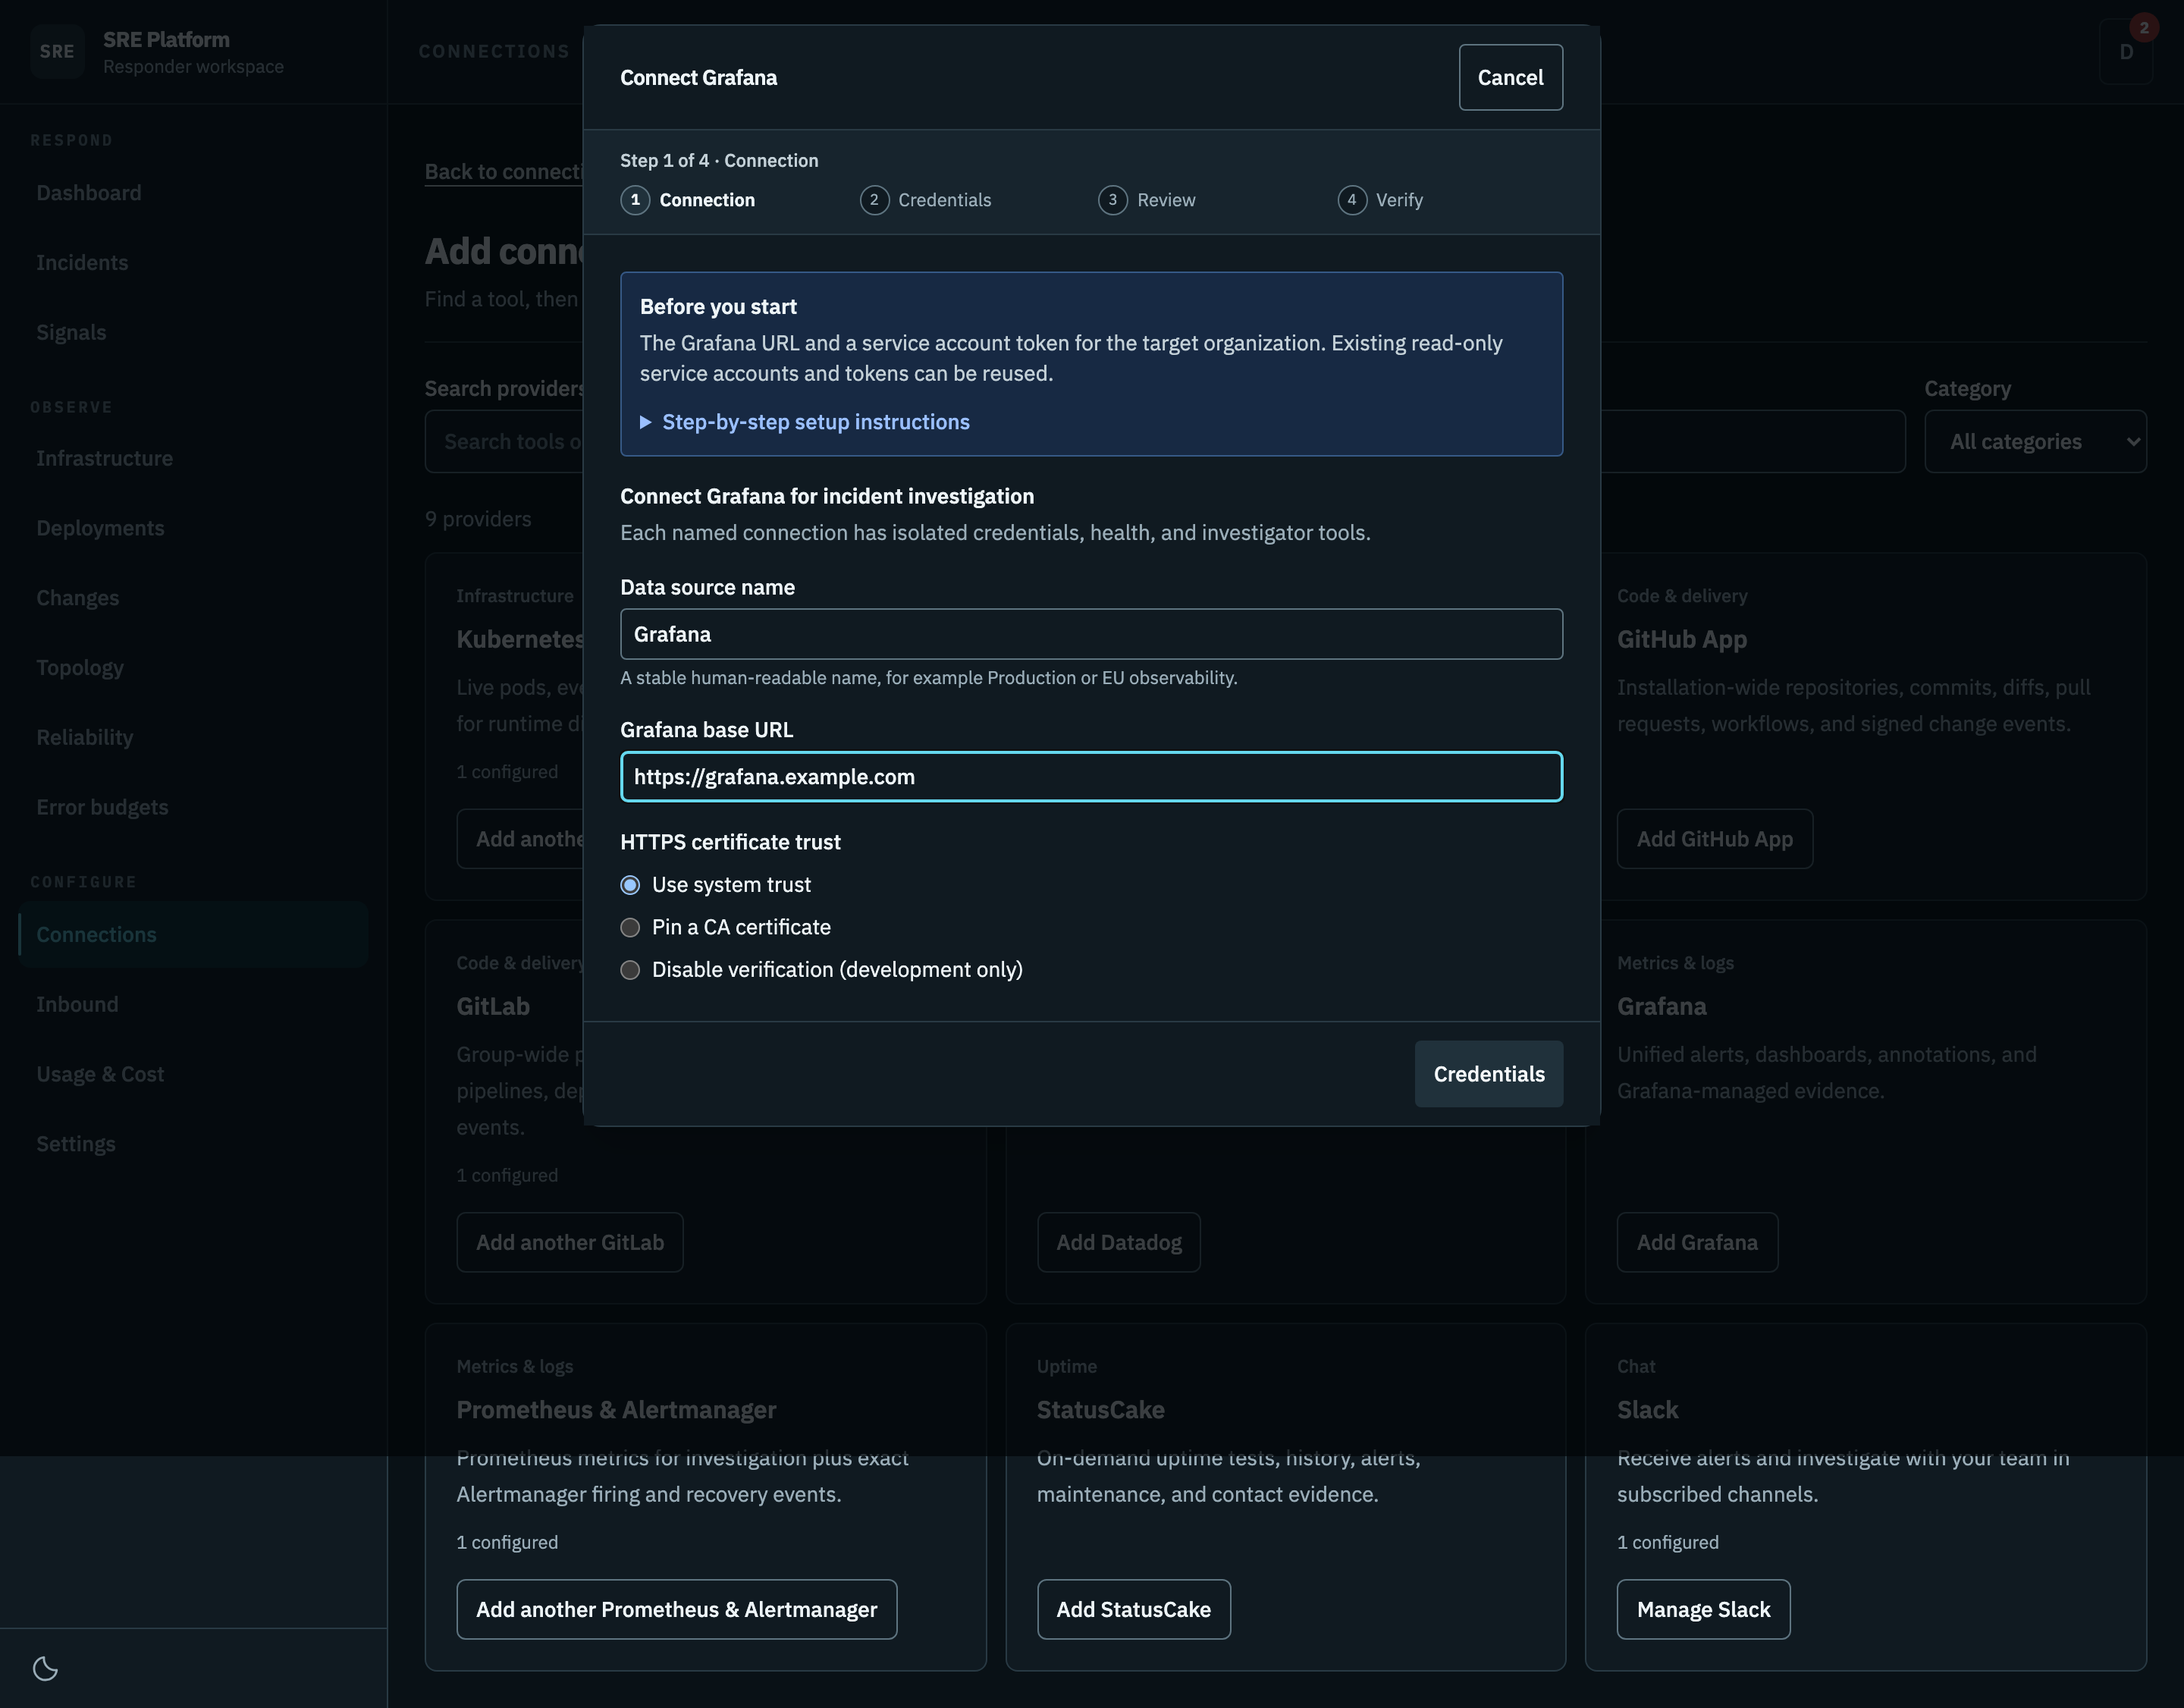
The address and its certificate trust. Plain HTTP has no encryption and makes you acknowledge that here. Use it only on a trusted private network. Loopback, link-local, and cloud metadata addresses are refused outright.
2. Credentials
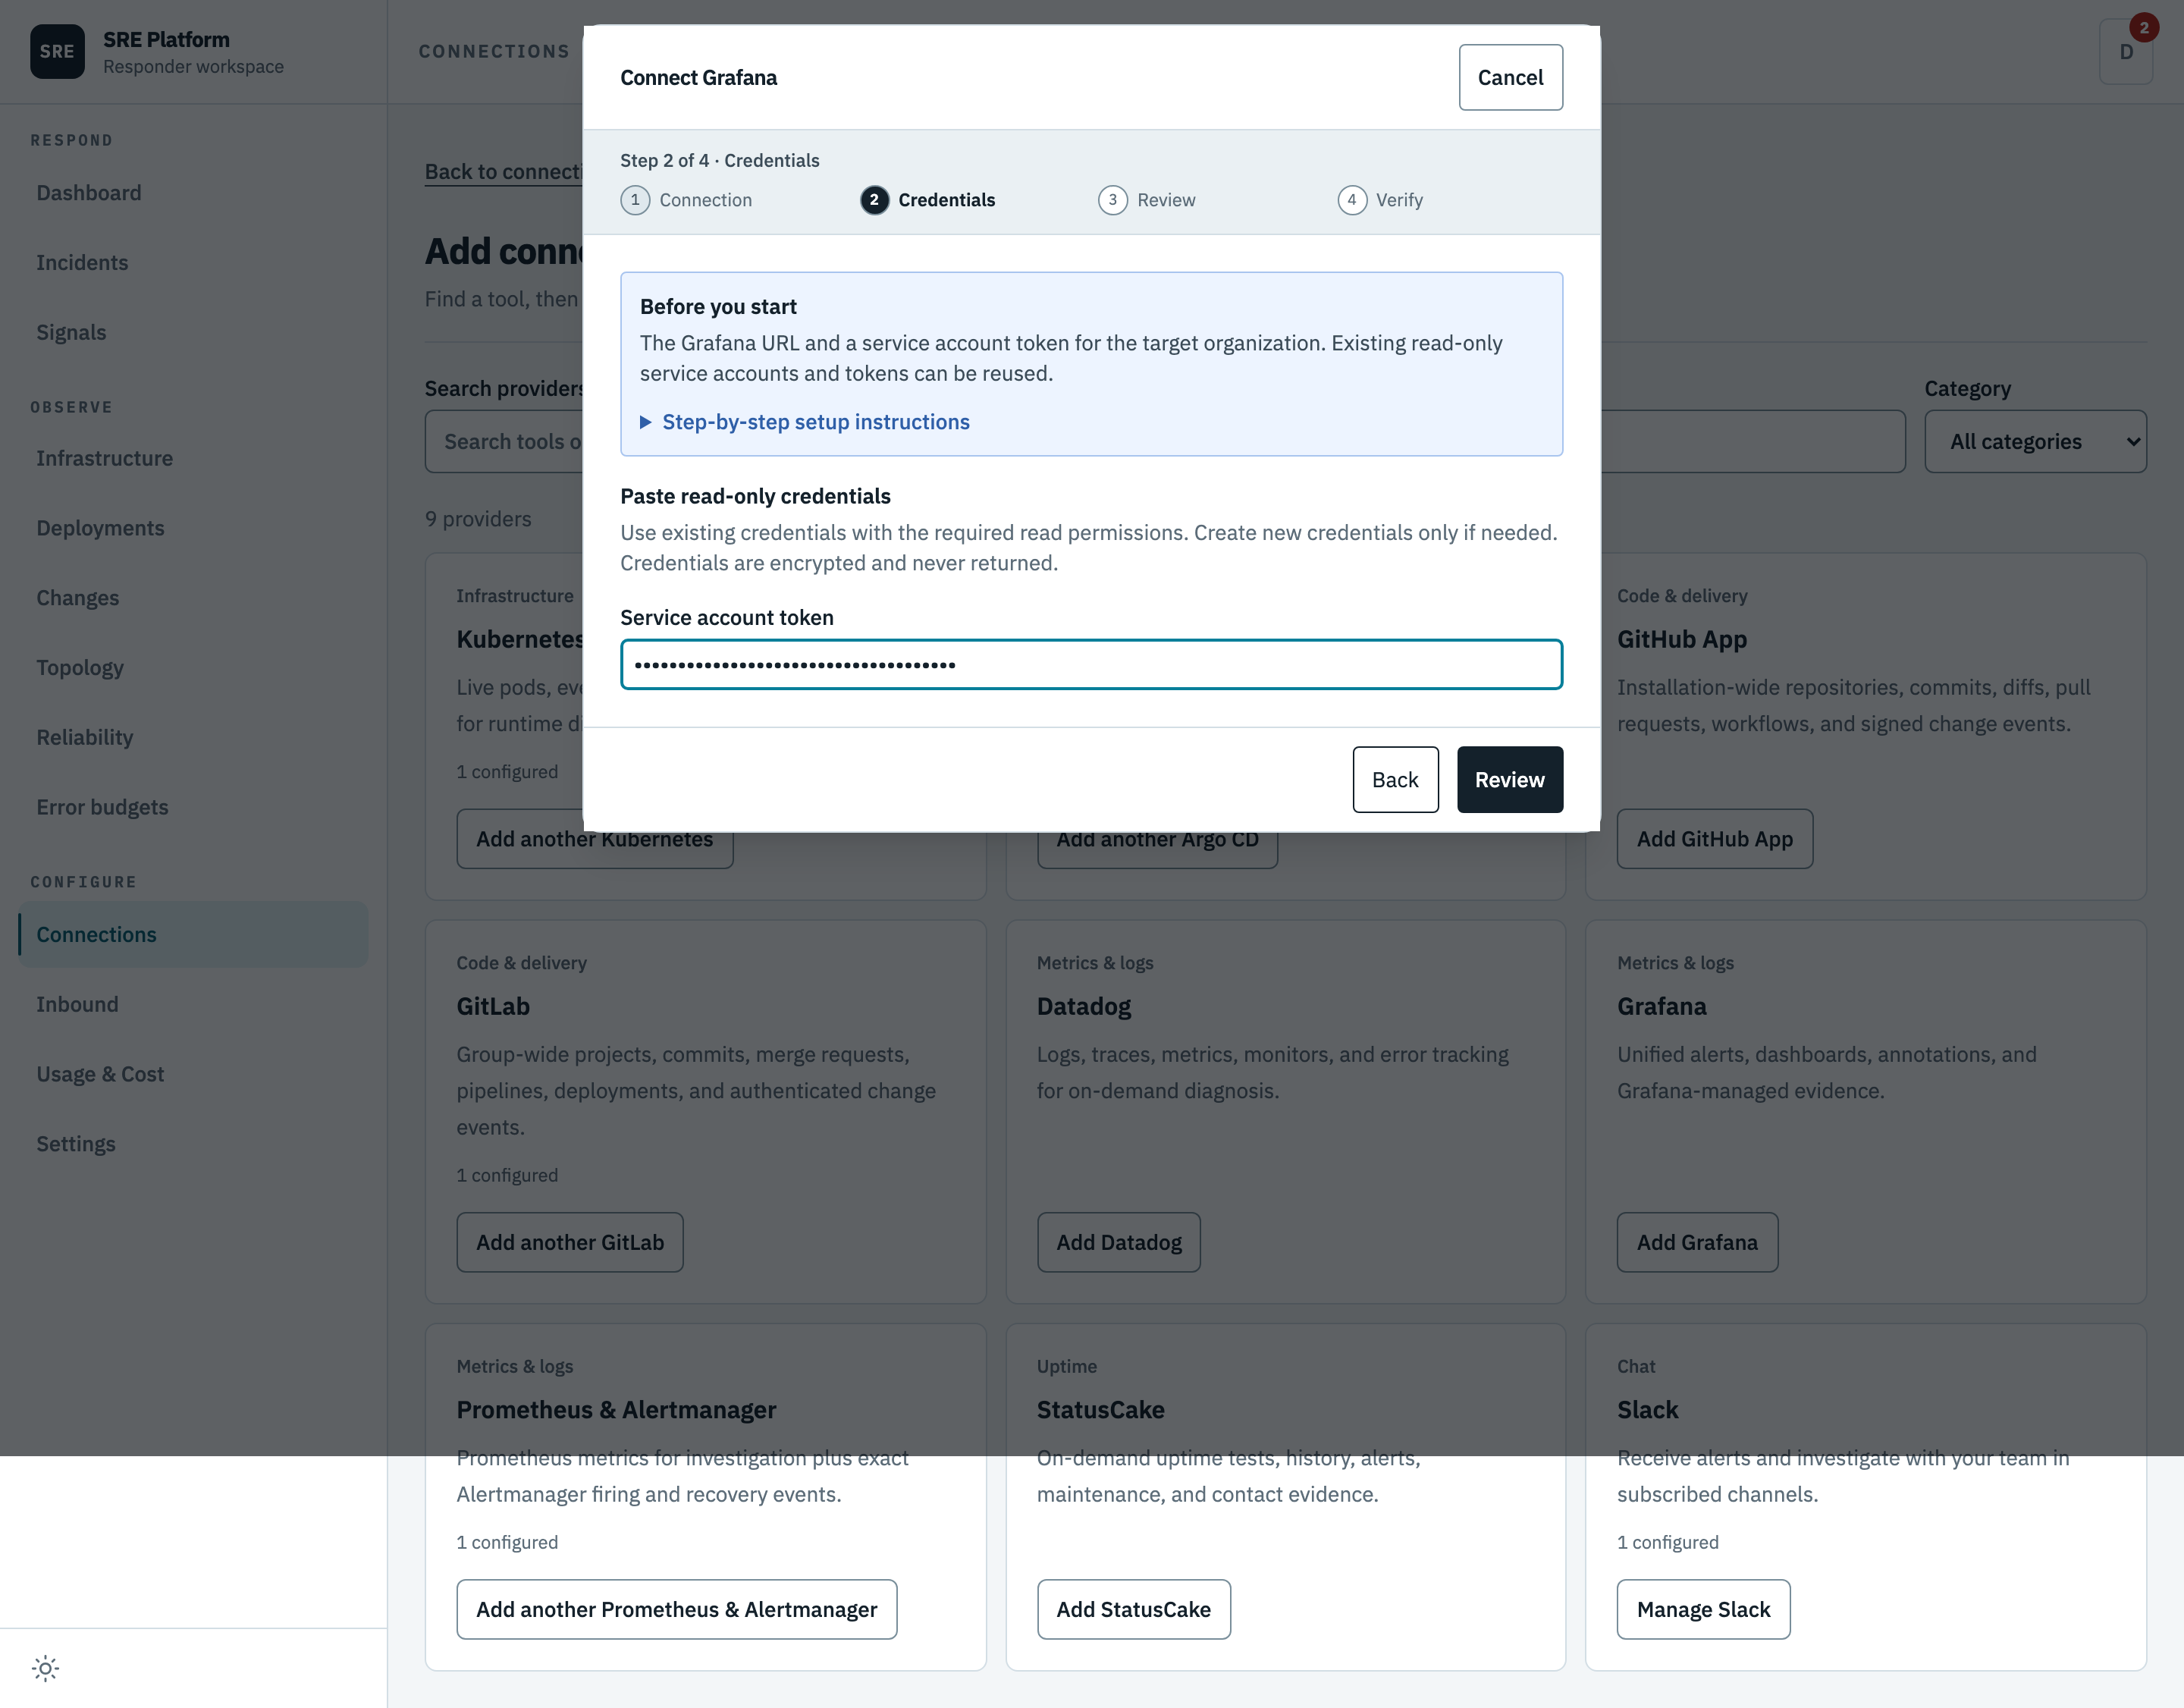
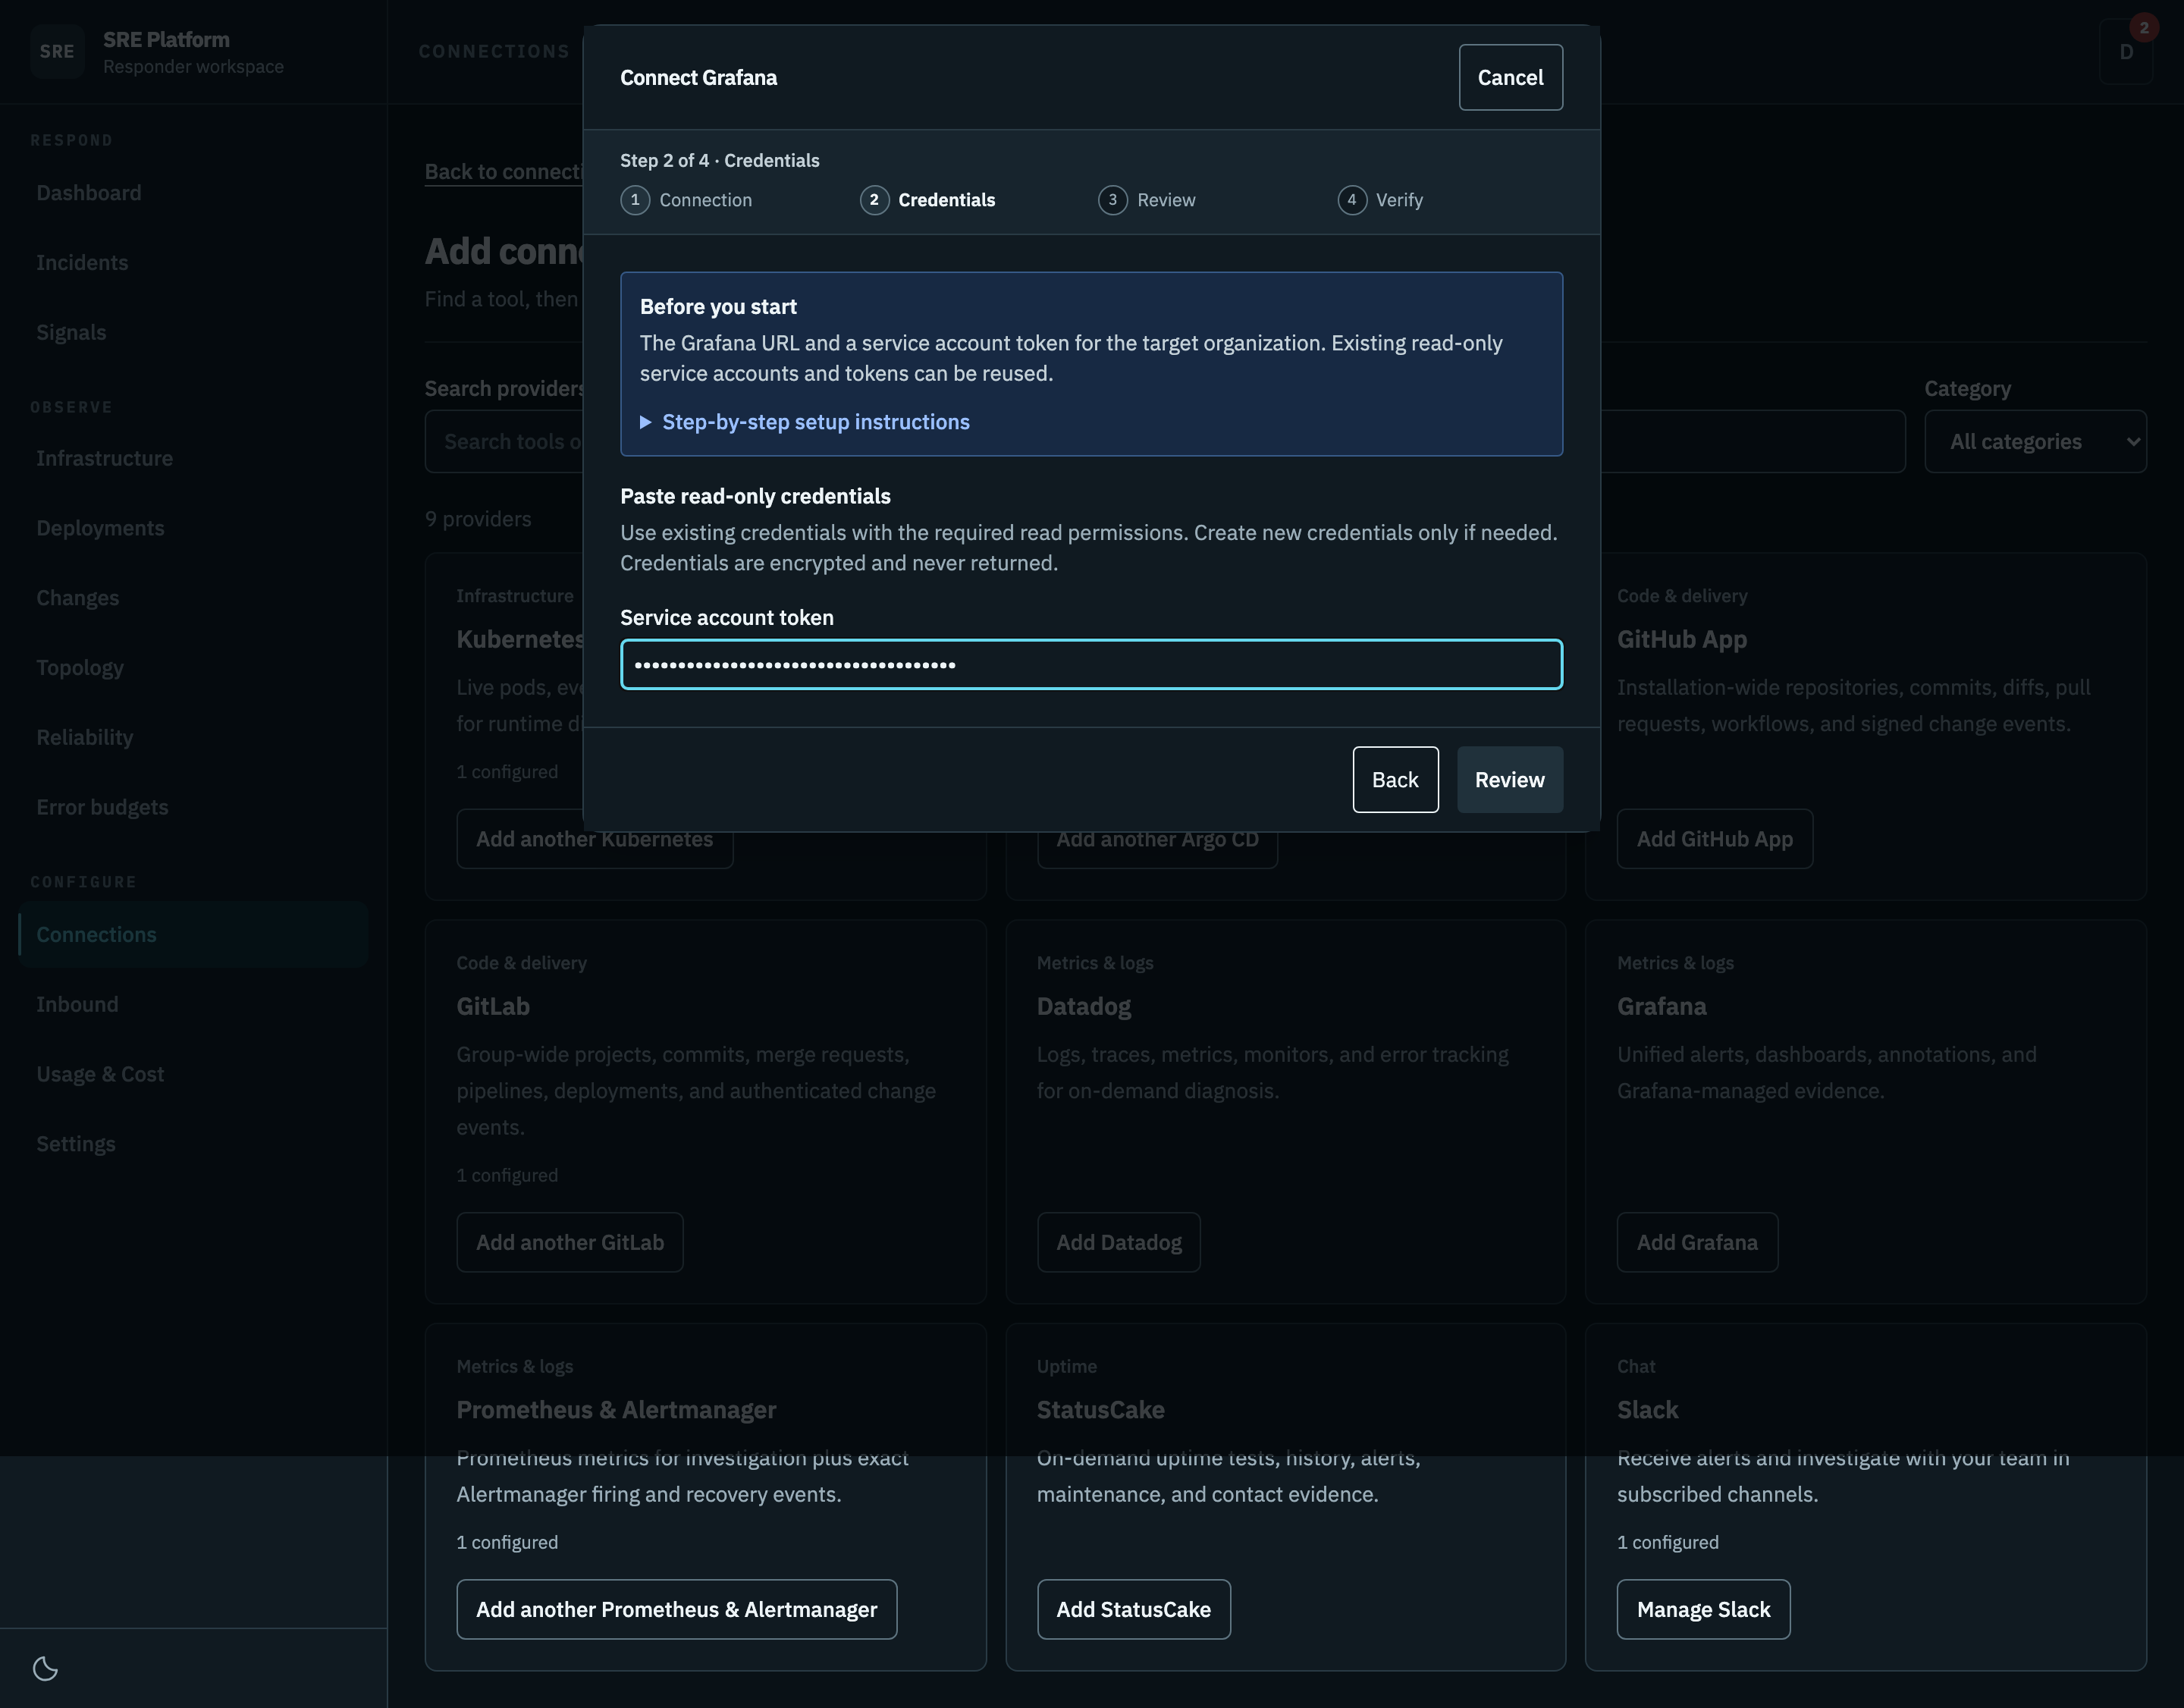
A service account token. It is stored encrypted and sent as a bearer token.
3. Review
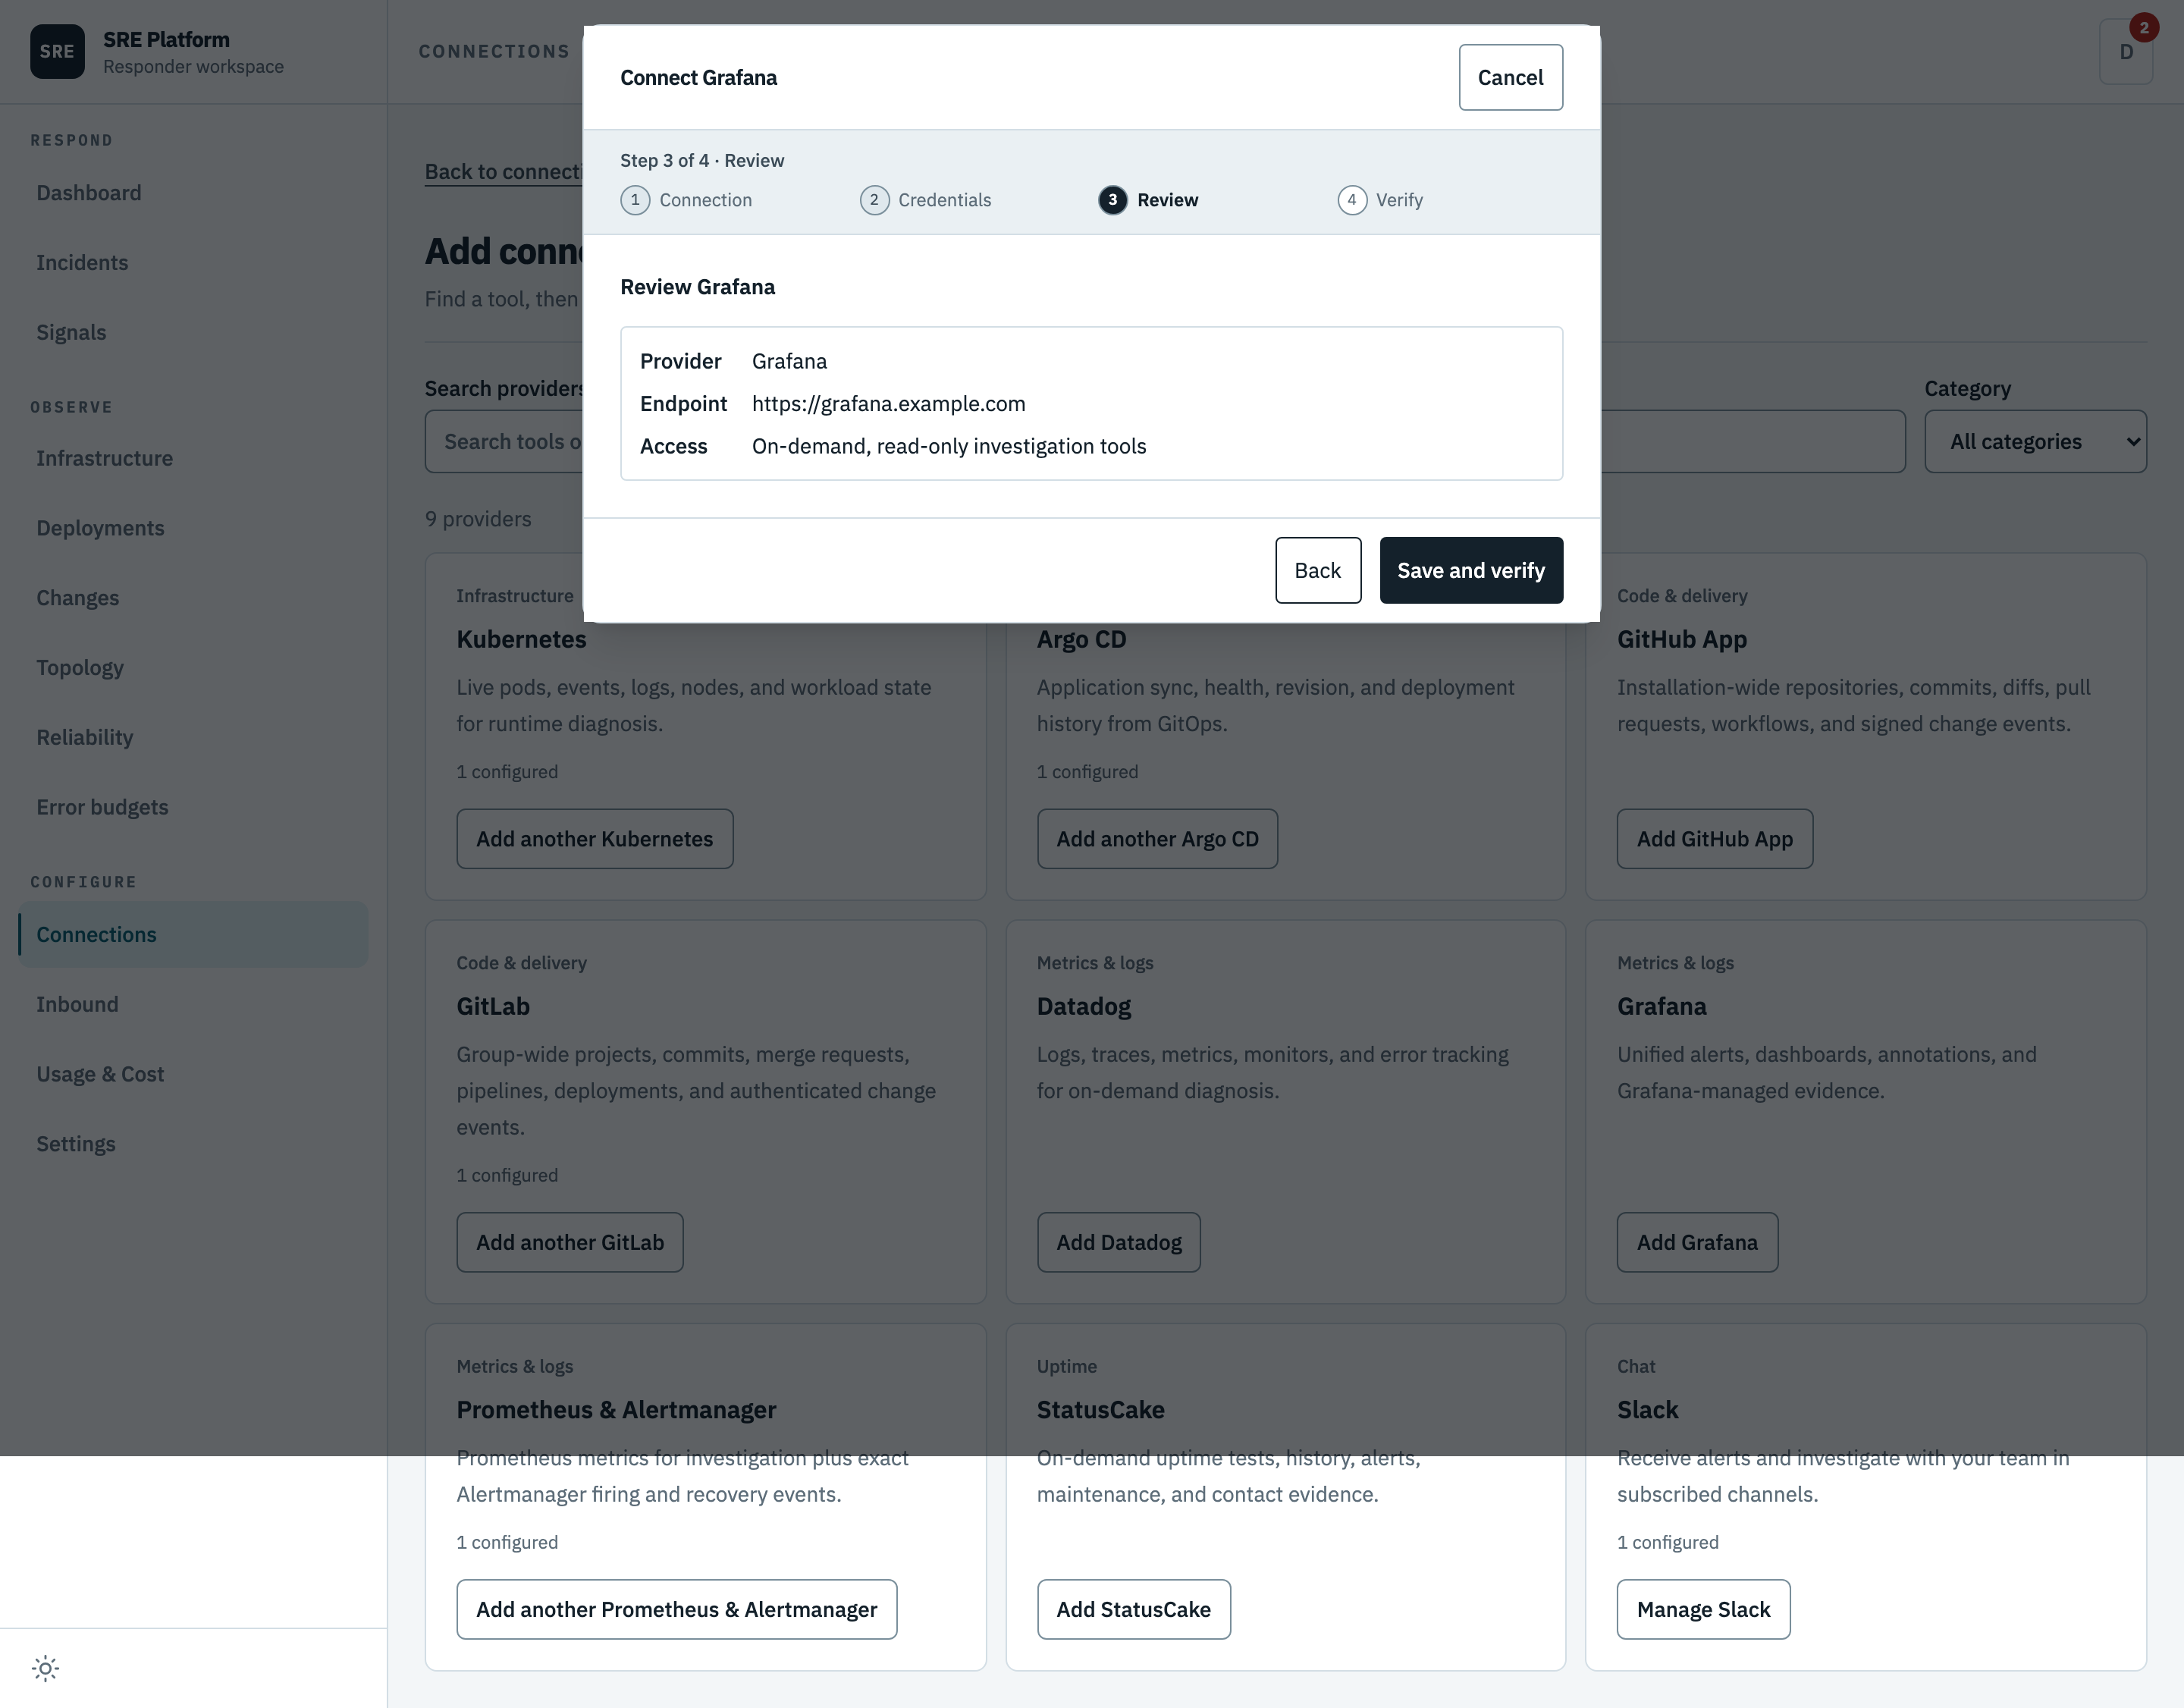
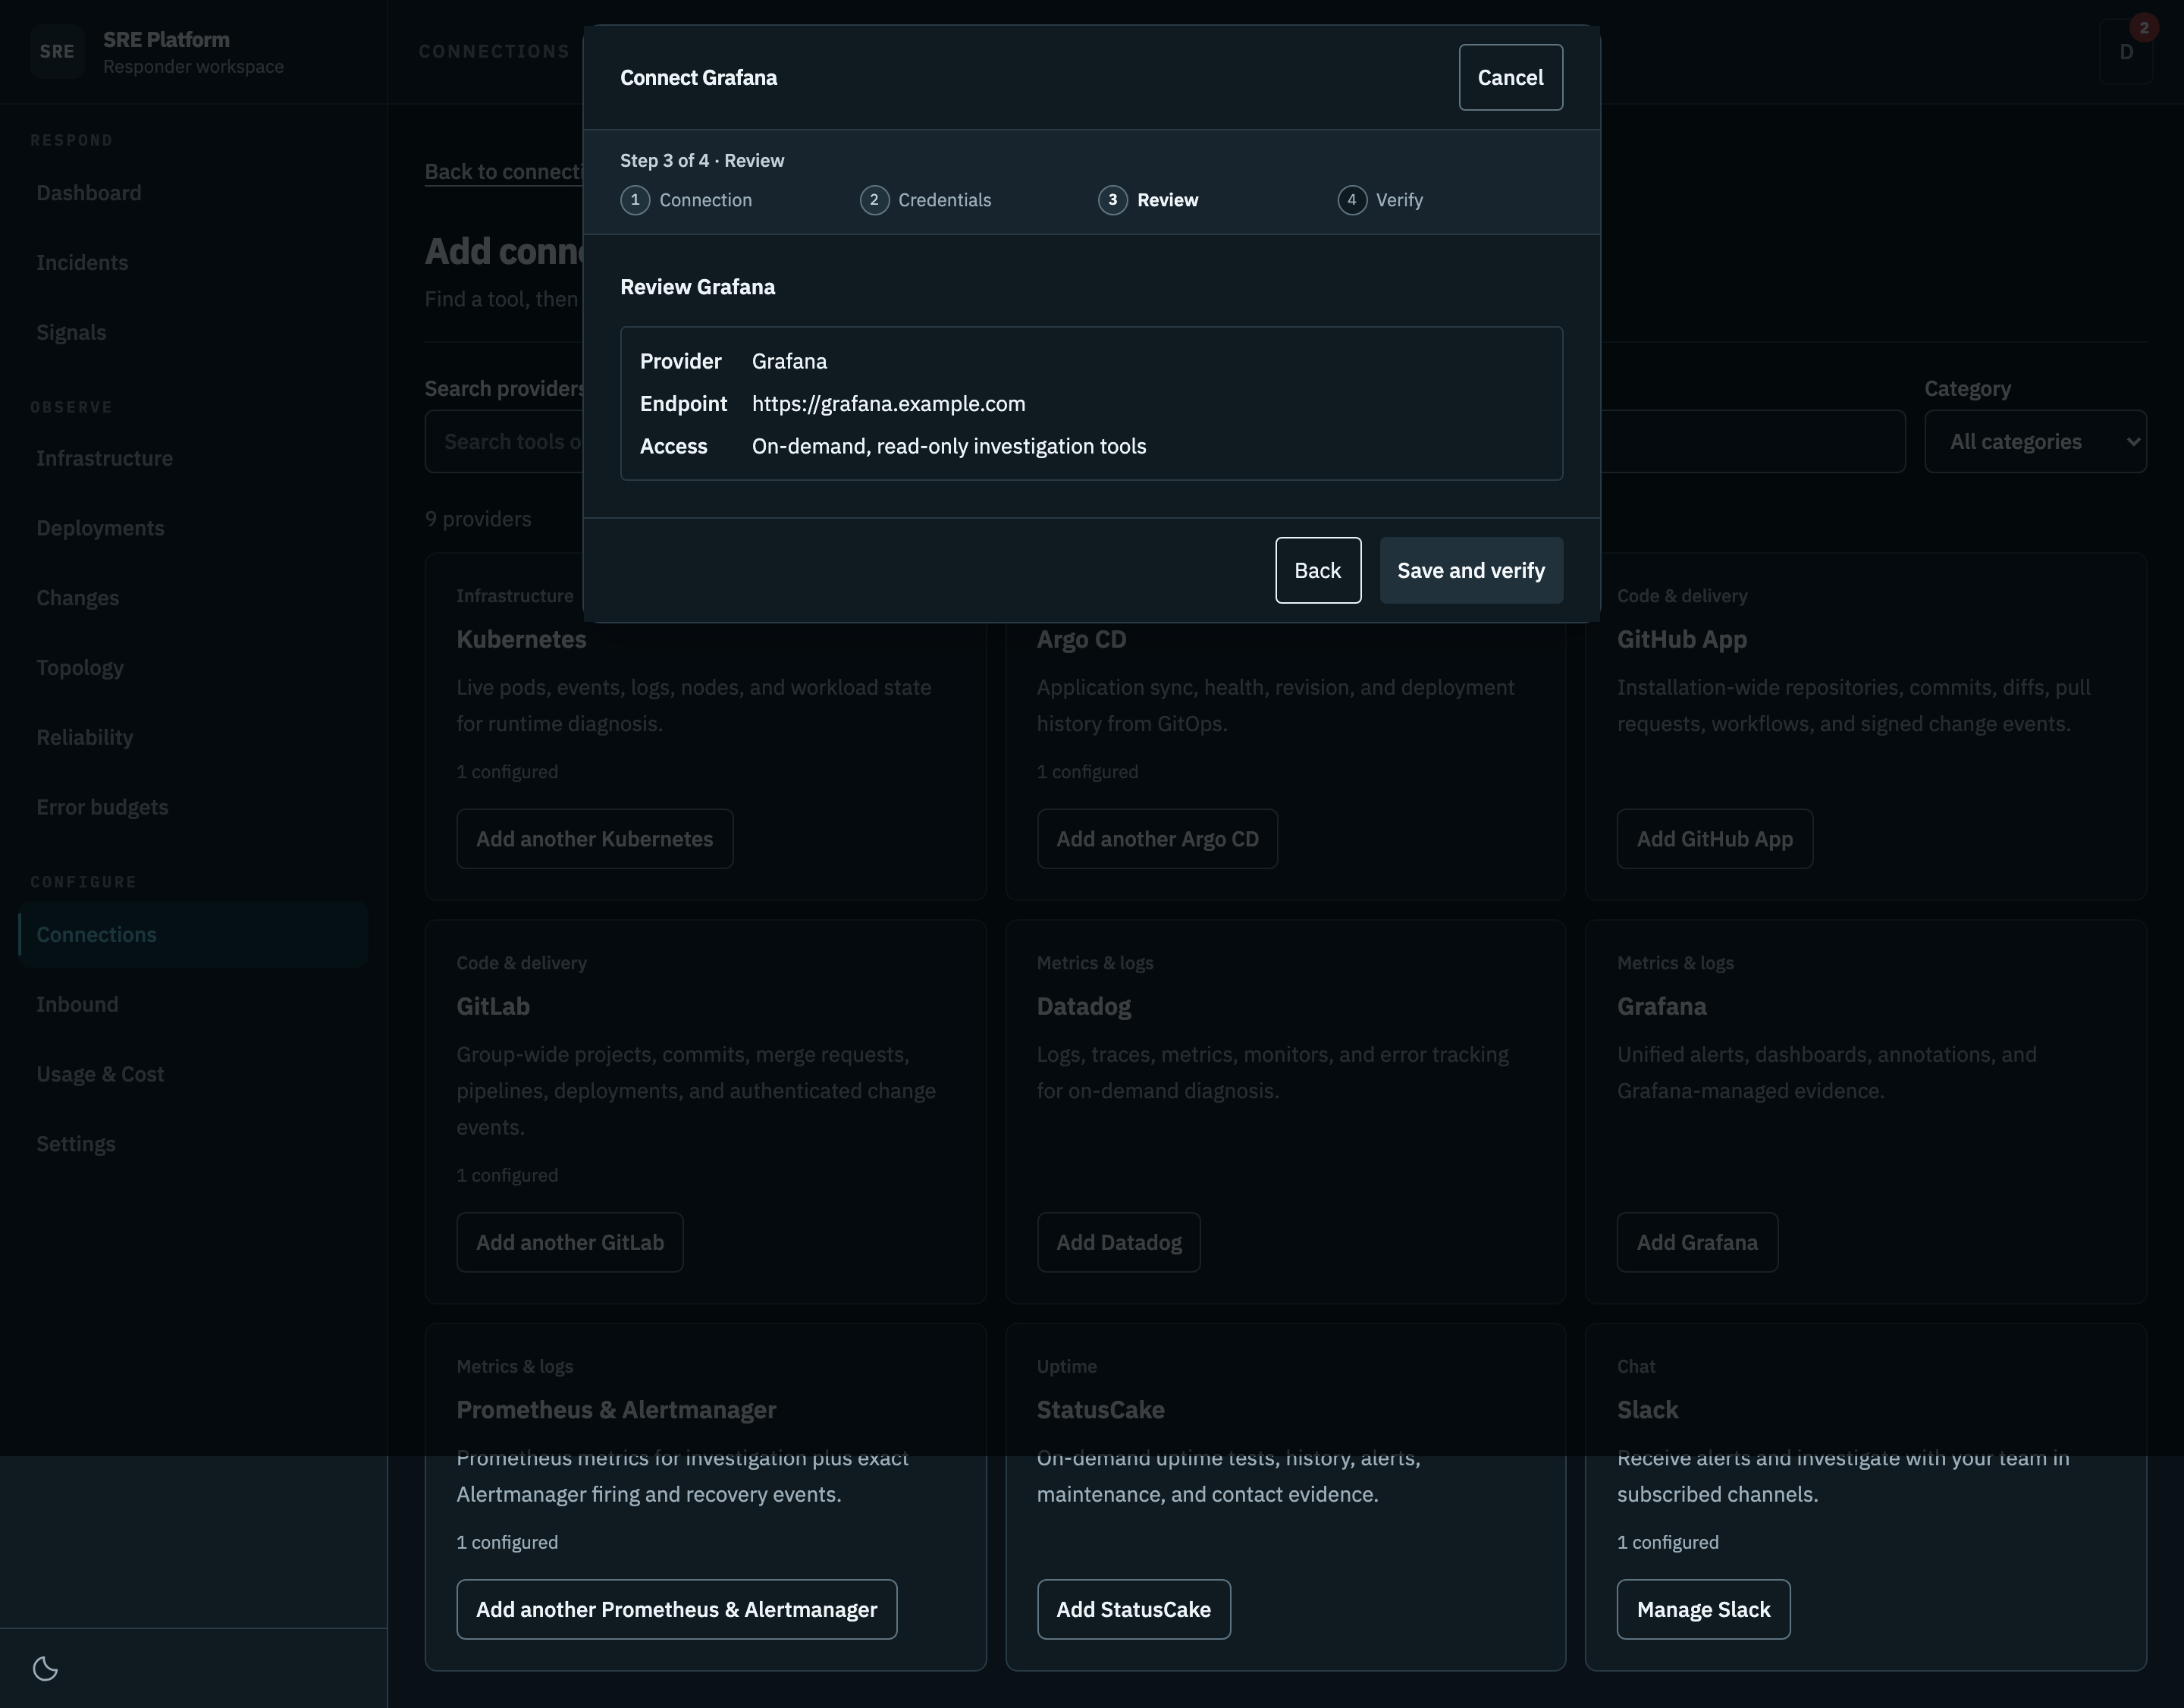
Provider, endpoint, and access mode.
4. Verify
Makes one authenticated read that any service account can perform. A success switches the connector on. A rejected token is reported as exactly that, rather than as an unreachable server.
This step runs against your real system, so it is not pictured here.
What it can read
| Tool | What it does |
|---|---|
list_alert_rules |
List alert rules and their current state (inactive/pending/firing) with active instances — the "what is alerting right now" signal (Prometheus-compatible shape). datasourceUid selects the rule source; default "grafana" (Grafana-managed rules). Pass an external datasource UID to read rules managed by that datasource. |
list_firing_alerts |
List the alert instances currently active in the Grafana Alertmanager — what is actually paging right now, after silences and inhibitions are applied. Optional filter is a list of label matchers (e.g. ["service=api", "severity=critical"]) to scope to a service. Optional silenced/inhibited/active booleans (defaults: active only). |
get_alert_rule |
Get one Grafana-managed alert rule by UID: its full definition — the query, condition, thresholds, and folder. Use to see the exact rule behind a firing alert. |
search_dashboards |
Search dashboards and folders (the human-curated views of a service). Optional query (title substring), tag (one or more), type ("dash-db" dashboards or "dash-folder" folders), and limit. Returns each hit with its uid — pass that uid to get_dashboard. |
get_dashboard |
Get one dashboard by UID: its full model — panels, their queries, and the datasources they read. Use to understand how a service is visualized and which signals its owners watch. |
list_annotations |
List annotations — deploy and event markers on the timeline (the deploy-correlation signal). Optional from/to (ISO 8601 or relative like now-1h; anchor to the incident onset), tags (one or more), type ("alert" state changes or "annotation" user events), dashboardUID to scope to one dashboard, and limit. |
list_datasources |
List the datasources this Grafana fronts (name, type, uid) — discover what backends are behind it. Secret credentials are redacted by Grafana (only which secret fields are set is returned). |
api_get |
GET any Grafana HTTP API endpoint by path (e.g. "api/folders", "api/dashboards/tags", "api/alertmanager/grafana/api/v2/alerts/groups"). Read-only. The datasource proxy/resources paths are refused (this connector stays on Grafana's own API). Use for anything the named tools do not cover. |
Every tool is a read, confined to Grafana's own API. Anything the model supplies as part of a path is character-validated first, and an encoded character in a path is refused outright.
The platform uses Grafana's long-standing dashboard API rather than the newer one, deliberately: it needs no namespace resolution and works identically across every Grafana version and edition.
What it looks at first
Before any model call, the platform pulls the alerts Grafana is currently firing and matches them to the incident's service by label where it can. When nothing matches it shows all firing alerts anyway, because Grafana has no universal notion of a service and "what is firing right now" is worth knowing regardless.
Why it stops at Grafana
Grafana is an aggregator, and its data source proxy will happily forward a request to whatever sits behind it and hand back the raw response. That response can contain a credential Grafana itself would have redacted.
So the connector refuses every proxy and data source resource path. That is one clean rule, instead of trying to write a scrubber for arbitrary responses from systems the platform knows nothing about.
Secrets in results
This connector has no redaction rules of its own. Grafana already omits data source secrets from its responses, returning only which secret fields are set, and refusing the proxy paths removes the only way an unredacted secret from a downstream system could arrive.
The one residual, an internal data source address, is topology rather than a credential.