The dashboard
The dashboard is where a responder works. The menu is grouped into three jobs: Respond (what needs a person), Observe (what the systems are doing), and Configure (what the platform may use). The incident workspace opens from any of them.
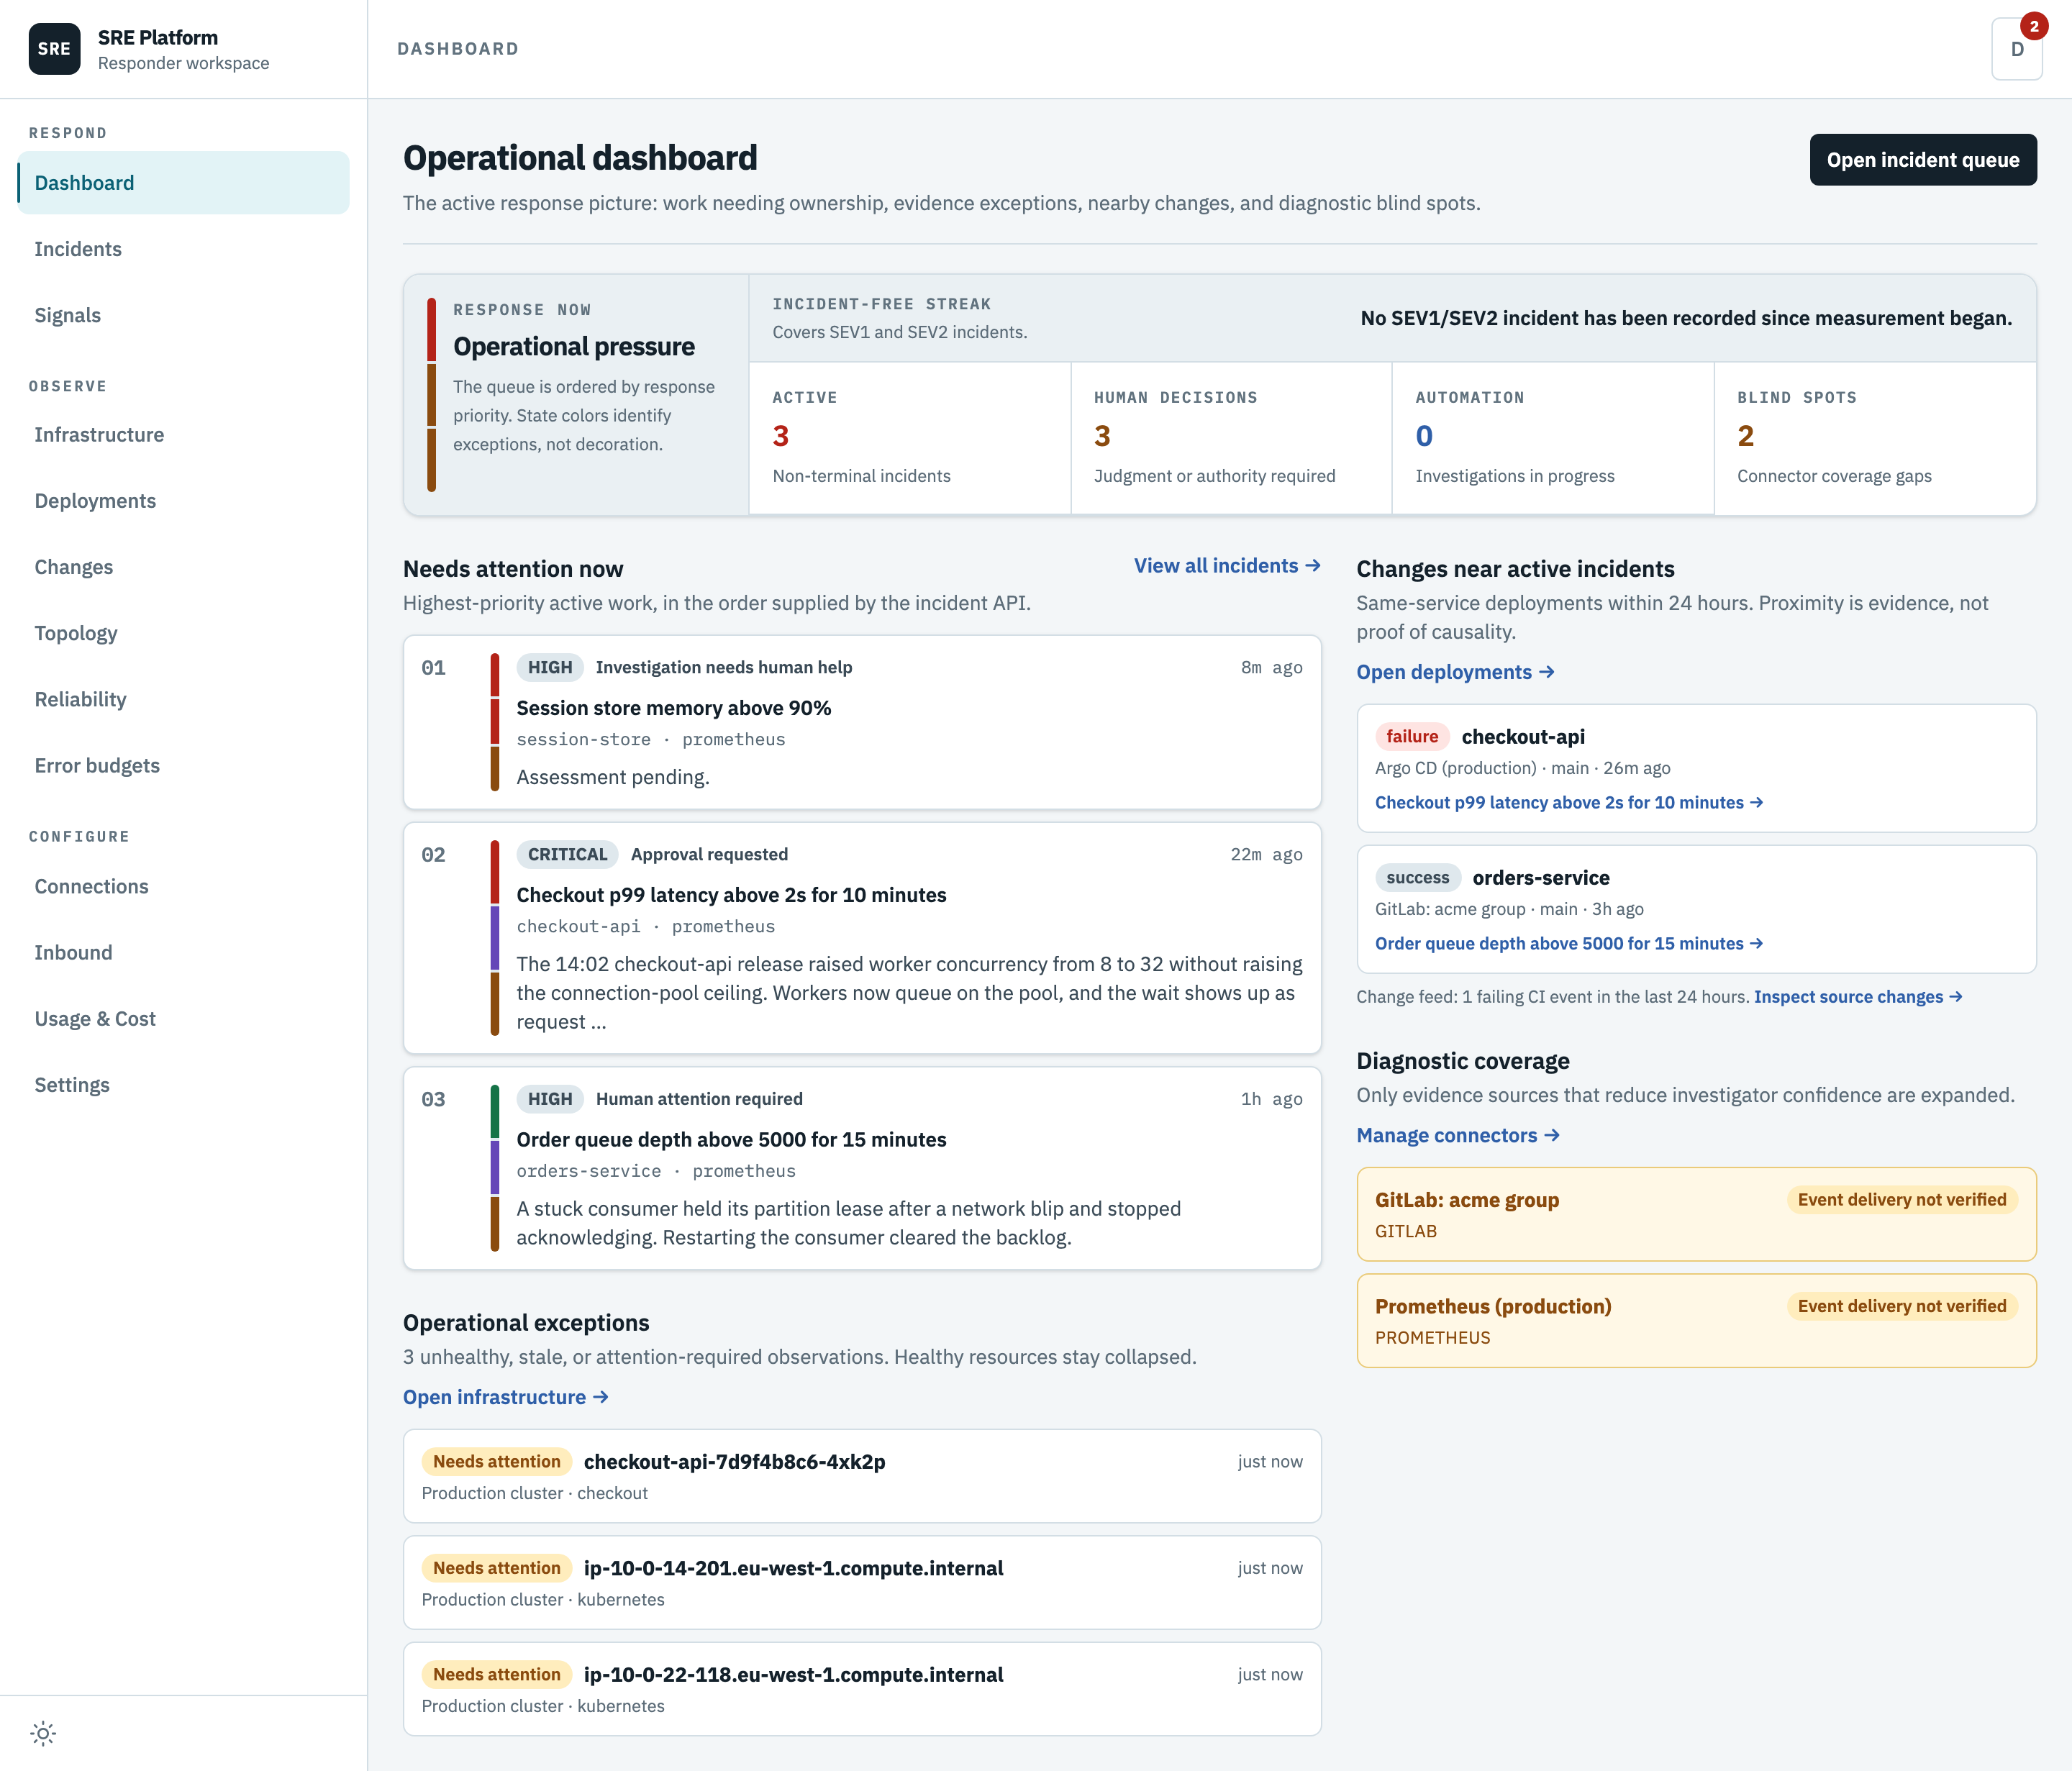
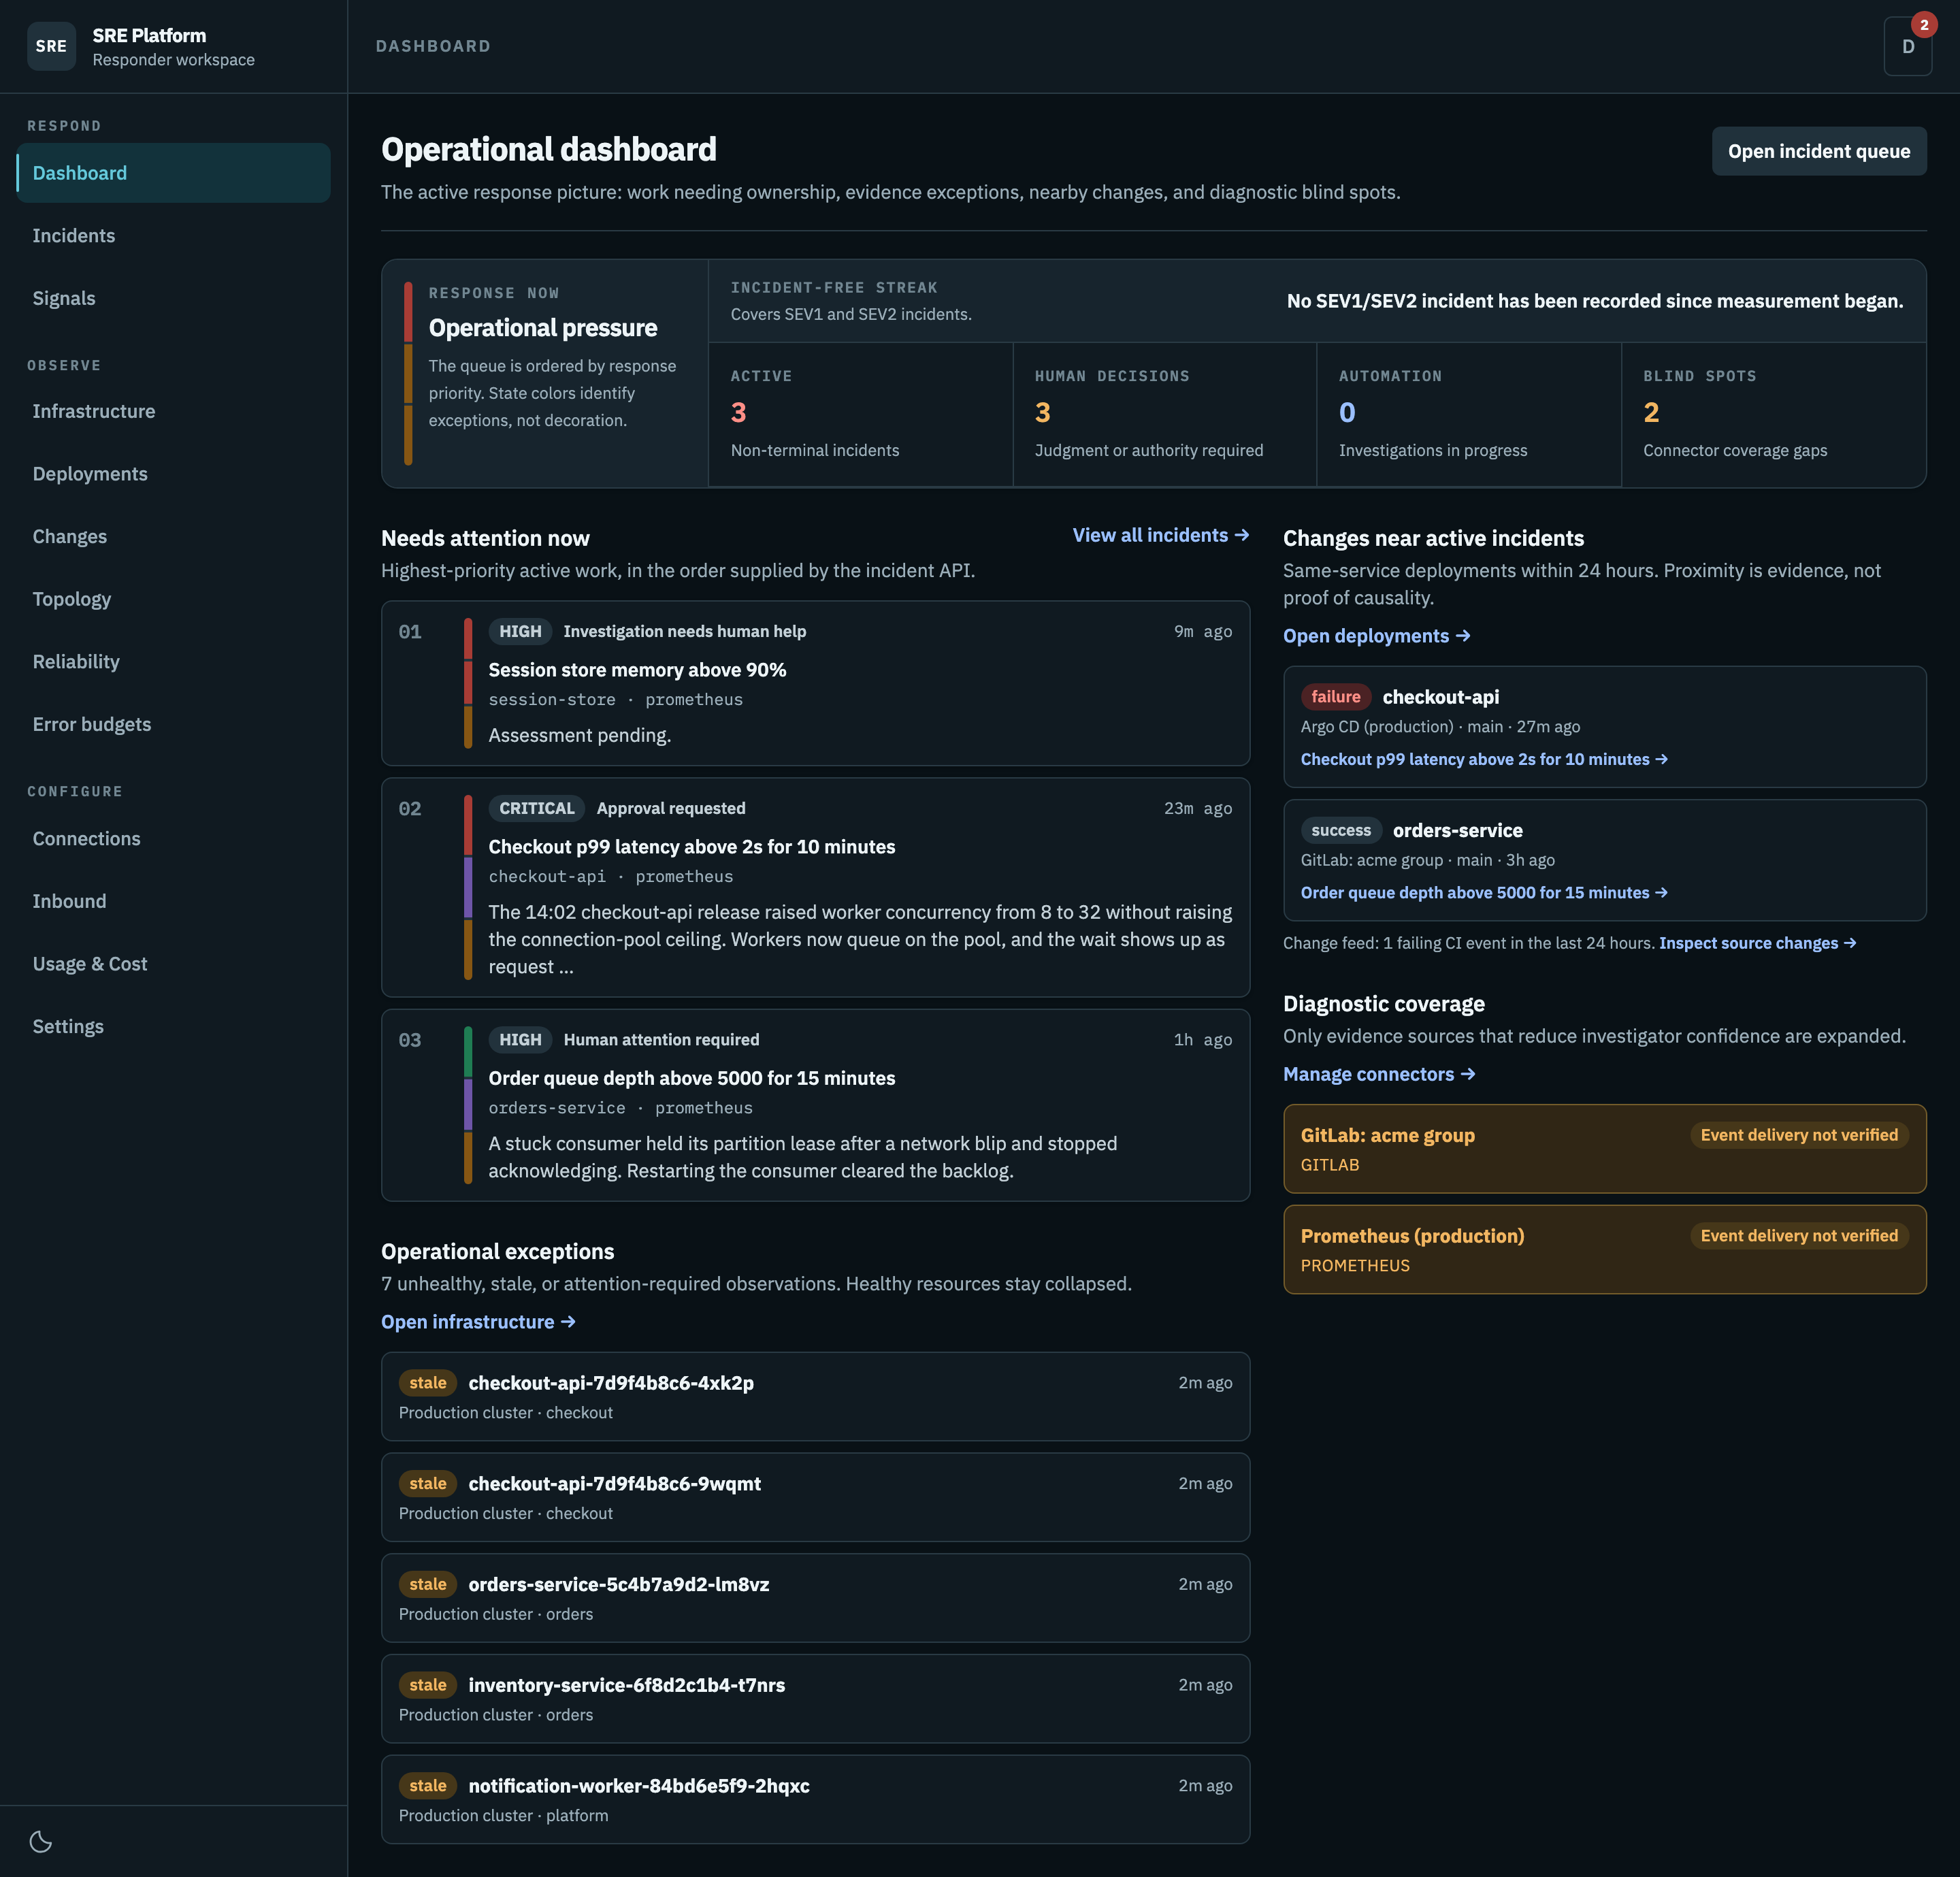
Every page here only reads. The platform holds no credential that can change anything you have connected, and nothing you see is visible to another organisation using the same deployment. See Connect your tools and Authentication.
Respond
| Page | Answers |
|---|---|
| Dashboard | What needs me right now? |
| Incidents | Show me every case, filtered how I want. |
| Signals | What came in, and was each signal routed to an investigation, a ticket, or the log? |
Observe
| Page | Answers |
|---|---|
| Infrastructure | Which pods and nodes are unhealthy? |
| Deployments | What shipped, and did it succeed? |
| Changes | What changed in source control? |
| Topology | If this breaks, what else breaks? |
| Reliability | Is this period better or worse than the last one, and which causes recur? |
| Error budgets | How much unreliability does each service have left, and how fast is it spending it? |
Configure
| Page | Answers |
|---|---|
| Connections | Which of my systems can it read? |
| Inbound | Which Slack channels does it listen to, and what did it do with them? |
| Usage & Cost | What has the model cost me? |
| Settings | What is the workspace called, how do people sign in, and who belongs to it? |
Two pages sit outside the menu. The incident workspace answers "what happened on this one incident?" and opens from any incident row. Notifications is the account inbox, opened from the account menu.
Platform-wide model, spending, registration, and email settings are not in this menu. They live under Platform administration → Platform settings, described in Platform administration and Triage engine.
Appearance
Use the appearance icon at the bottom of the menu to choose System, Light, or Dark. The choice is remembered per browser. Every screenshot in this guide is available in both, and follows the theme you have set for this site.