Topology
Explore services, workloads, deployments, repositories and monitoring resources collected from your connections. Automatic discovery does not require a catalog entry or manual runtime mapping.
Follow discovered relationships
Choose Map to explore relationships or List to browse resources. Search by name or scope, then filter by kind, connection or scope. Selecting a resource updates the page address so you can share or reload the exact selection. Equal names in different clusters or environments stay separate.
The map has three views:
| View | Shows |
|---|---|
| Runtime traffic | Observed calls between workloads and endpoints |
| Service dependencies | Service calls and explicit dependency declarations, labeled separately |
| Resource context | Ownership, deployment, routing, repository and monitoring links |
When no dependency relationships are available, the map opens Resource context. Management and routing links are not treated as calls to fill a gap.
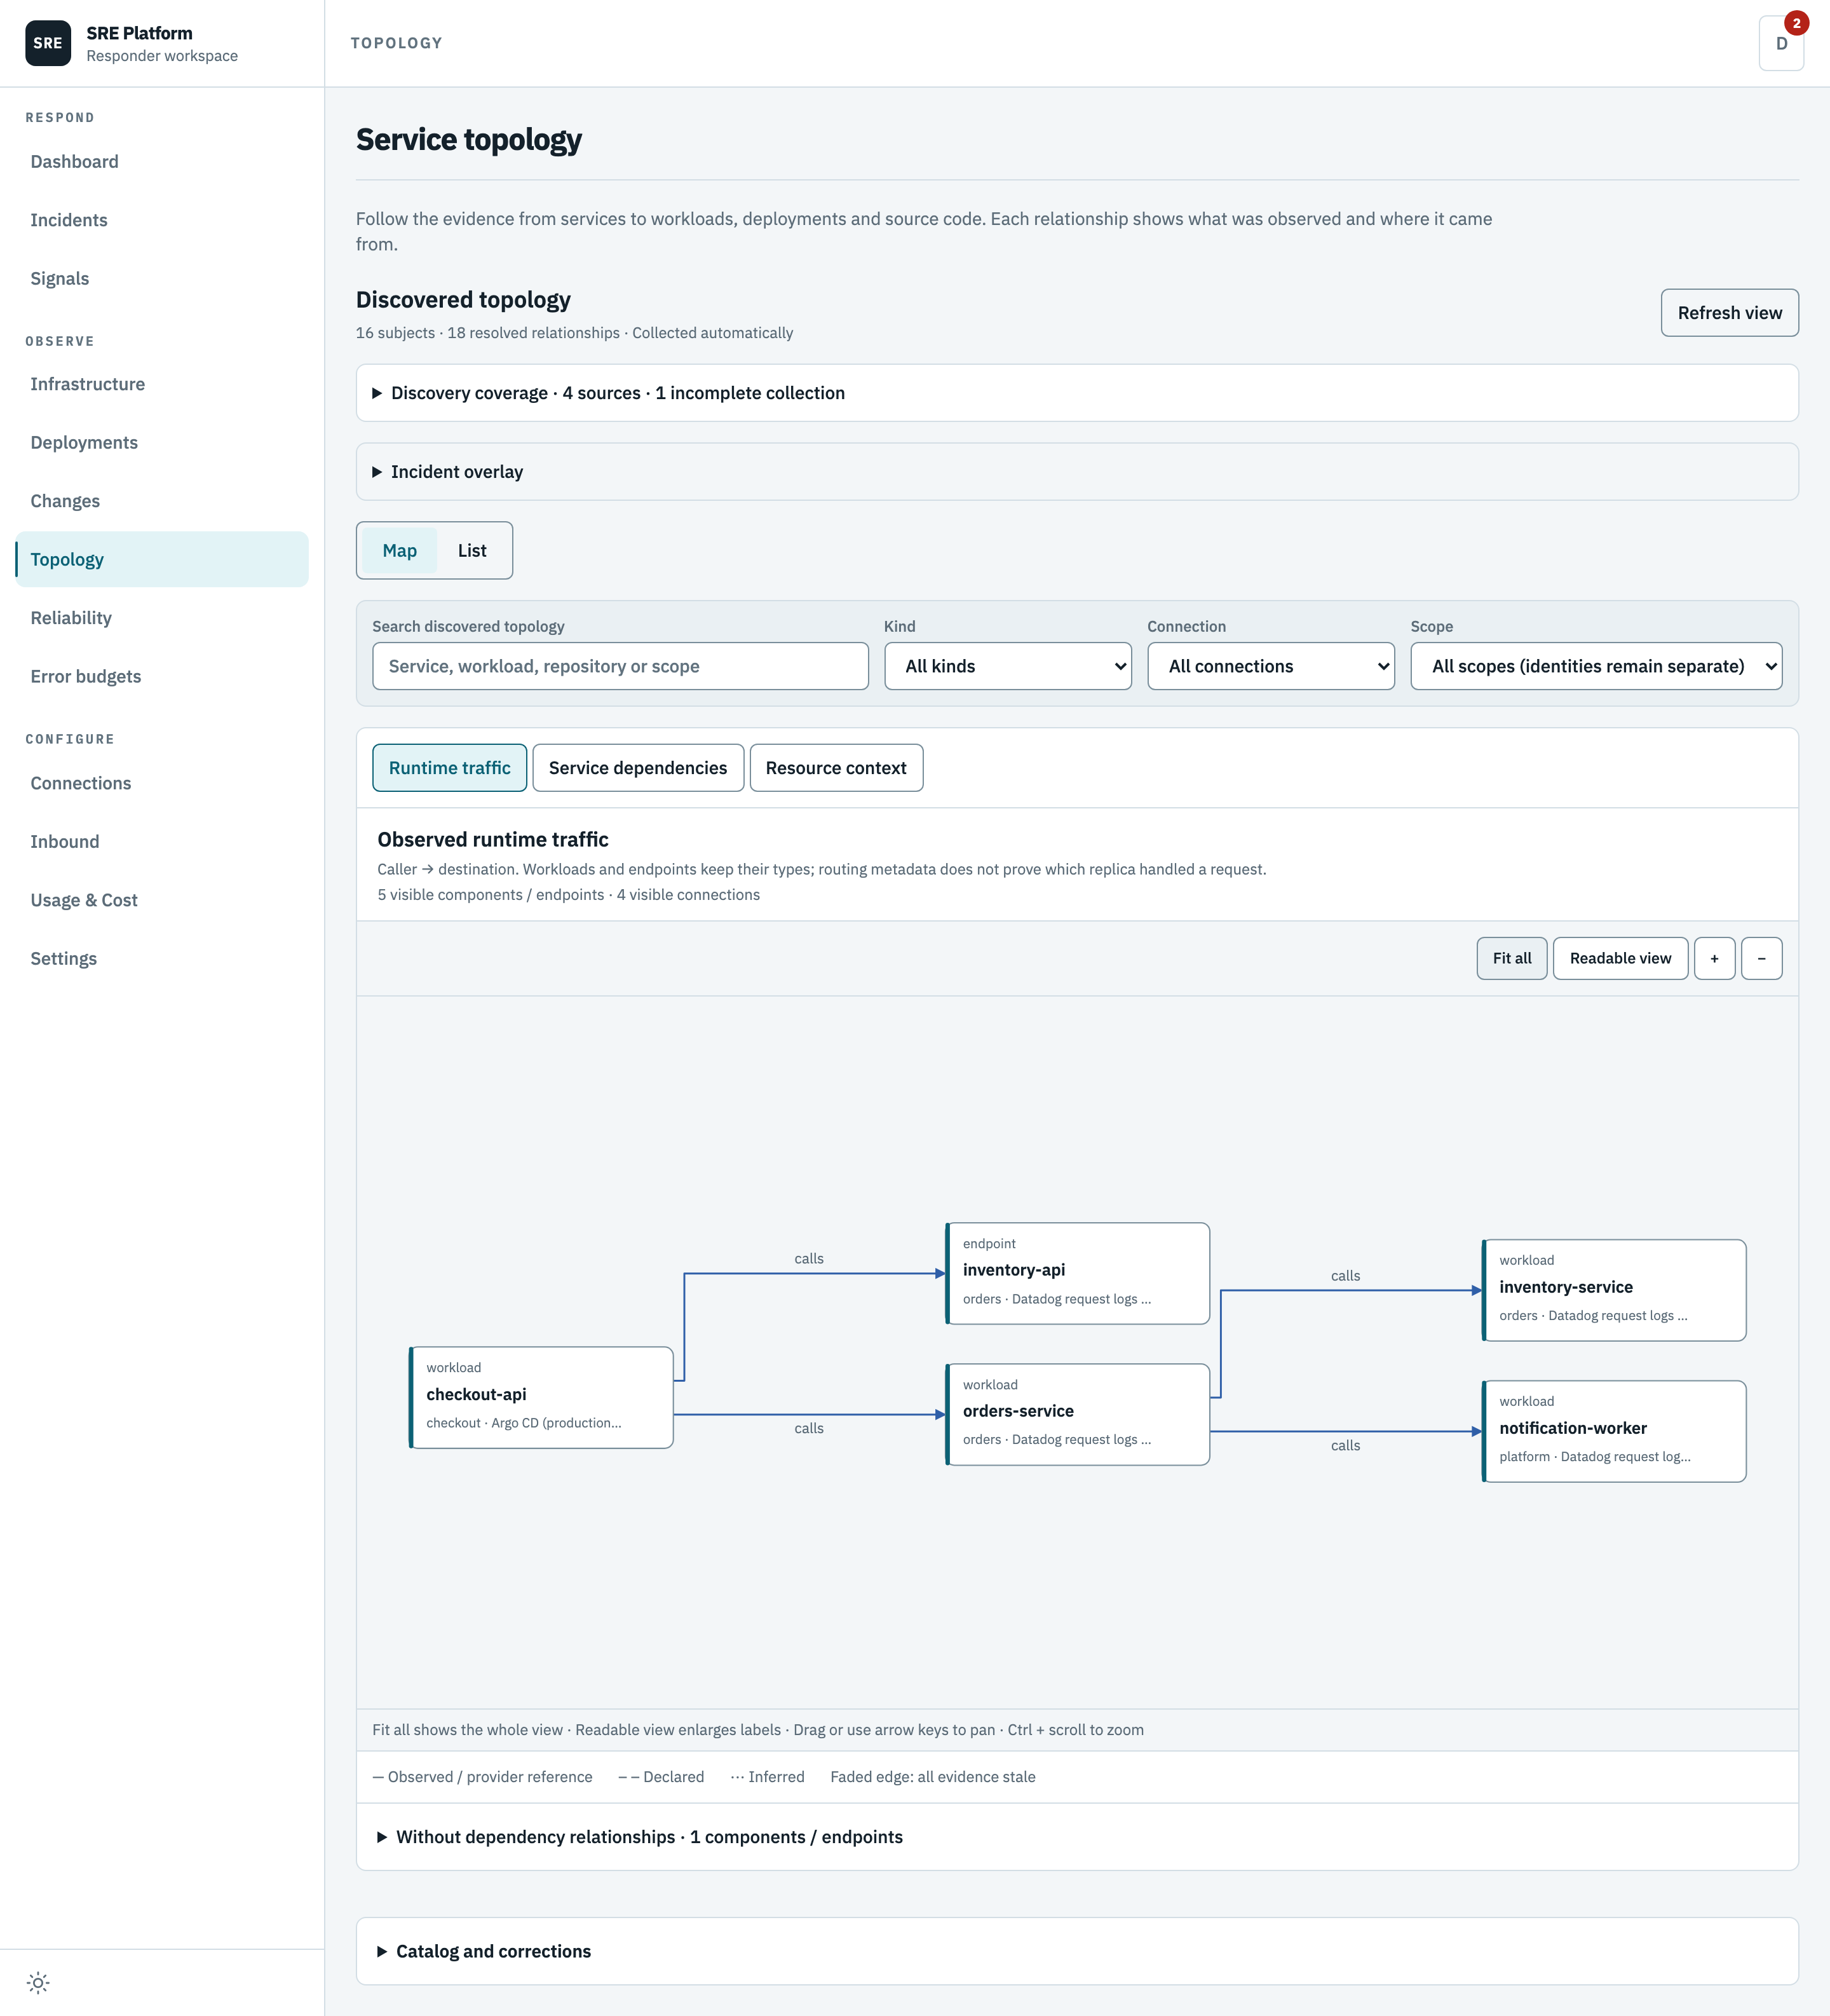
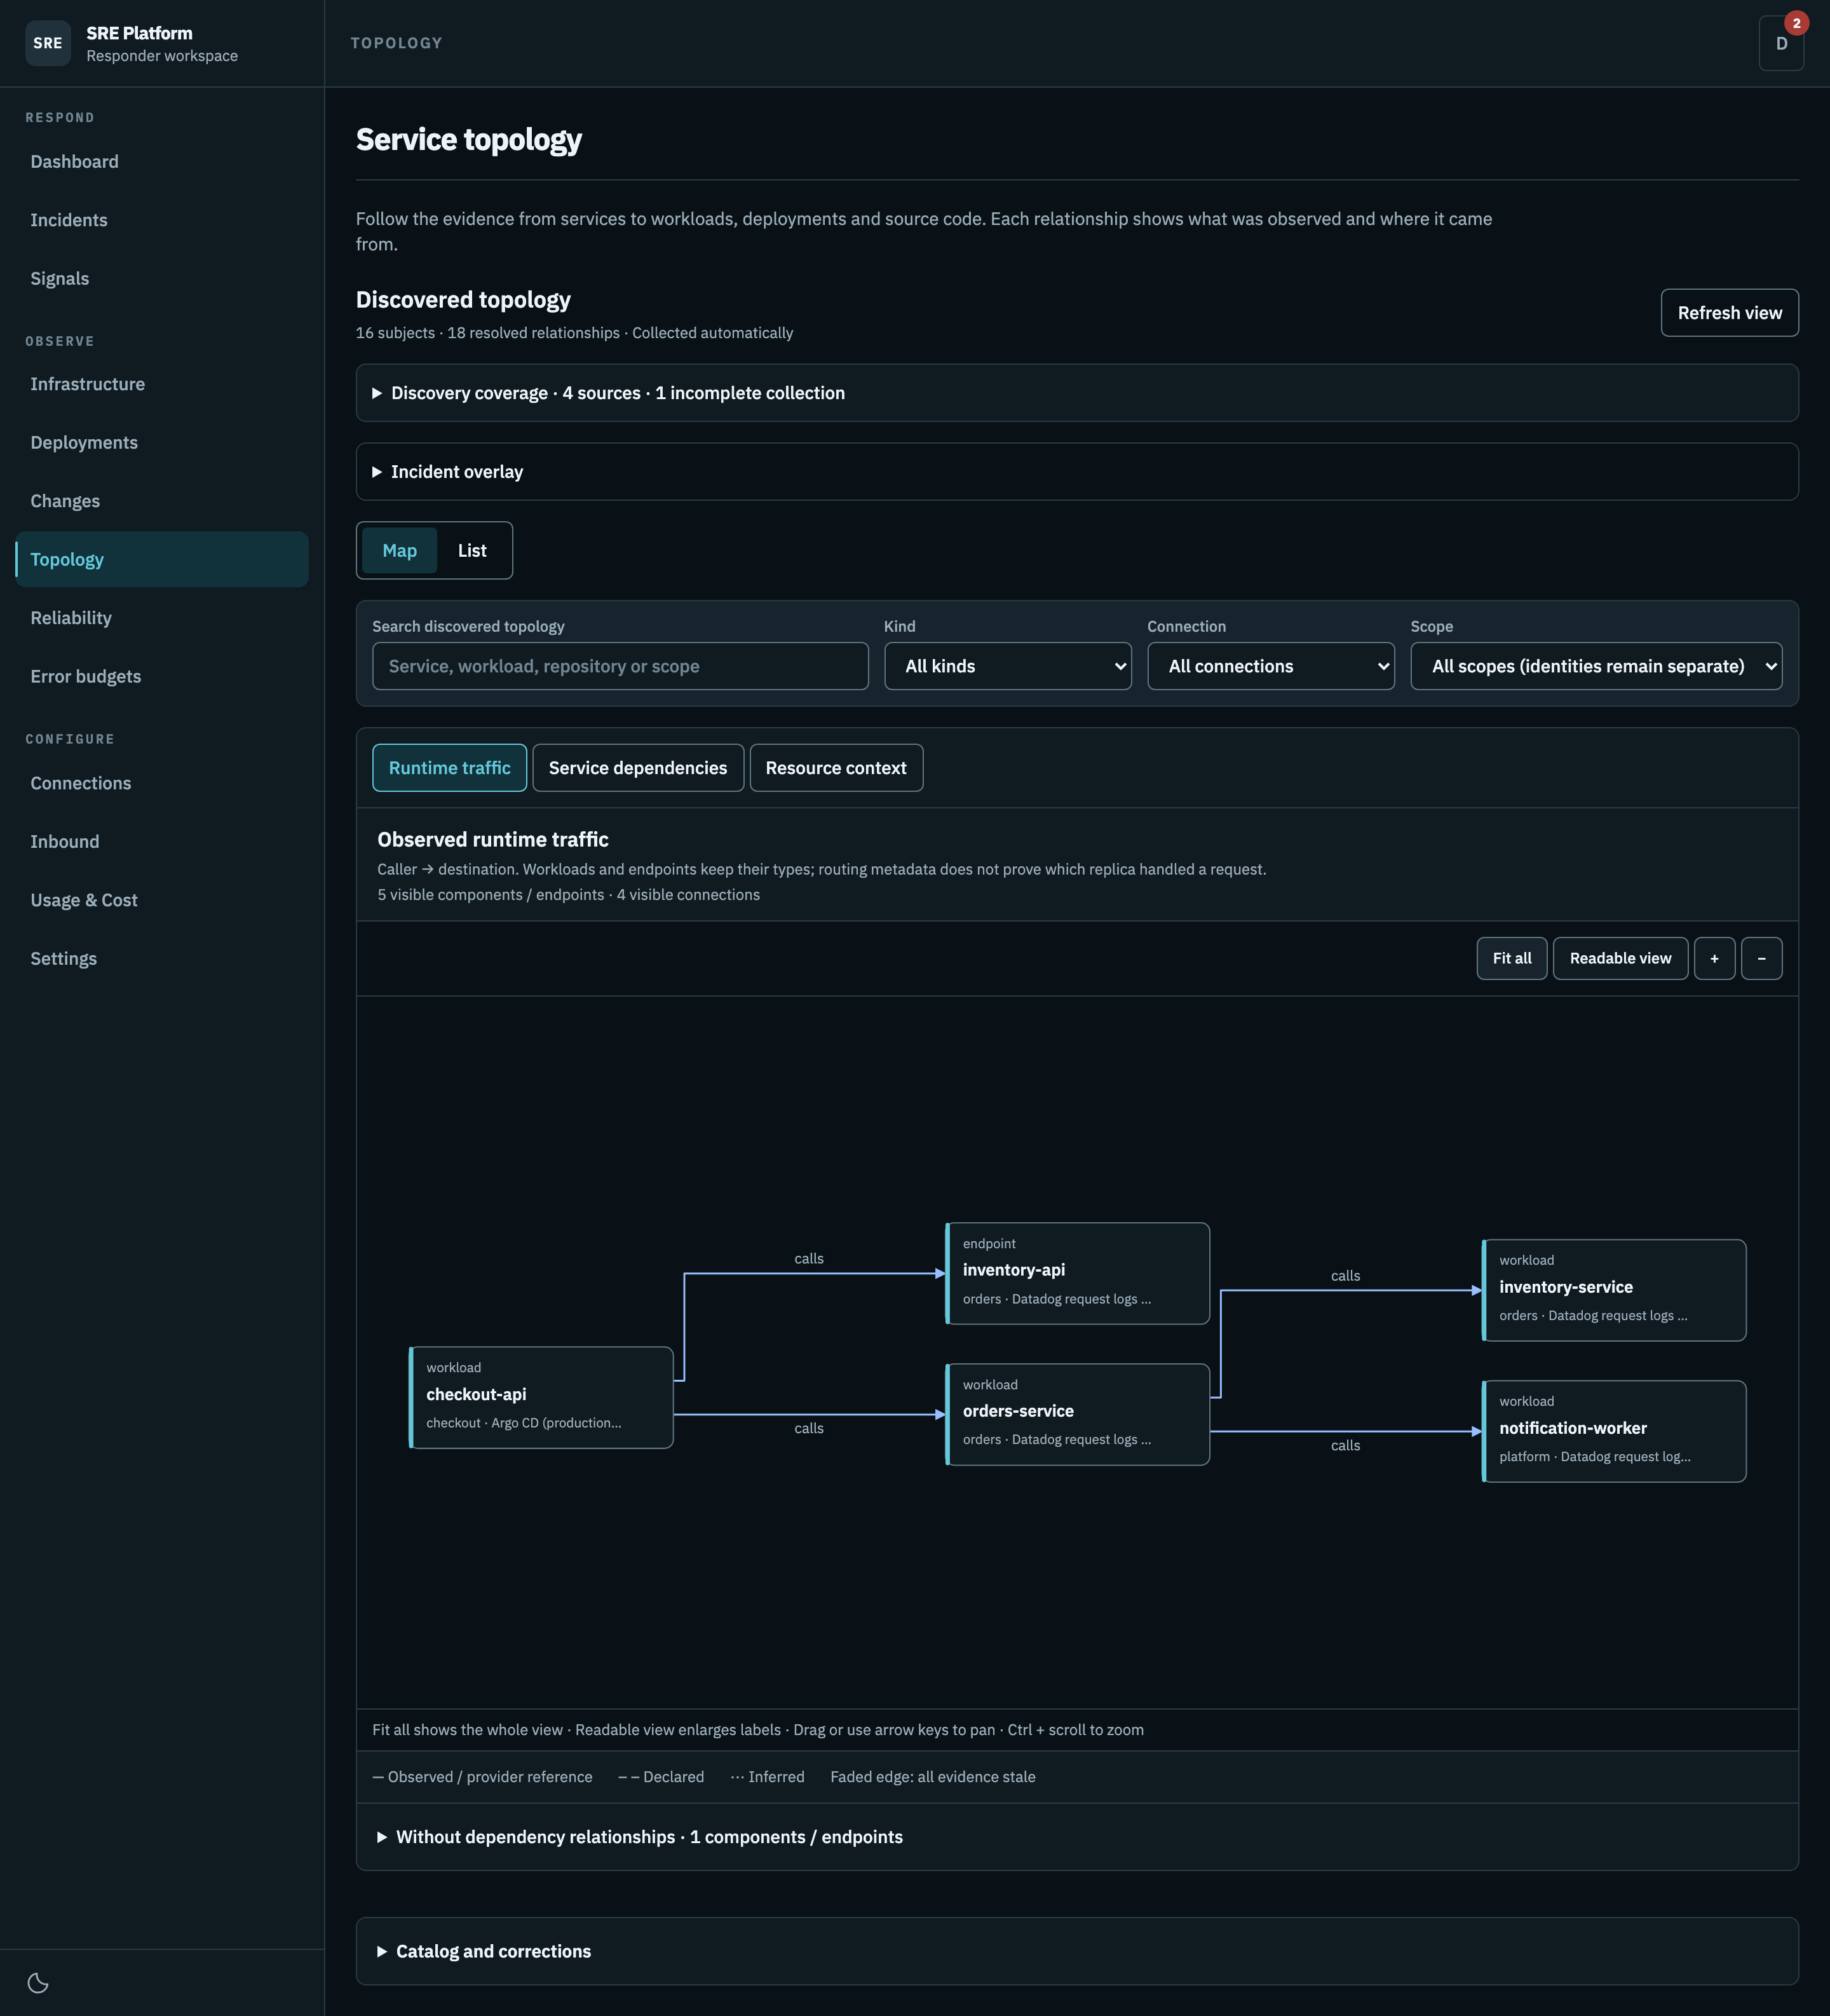
Runtime traffic
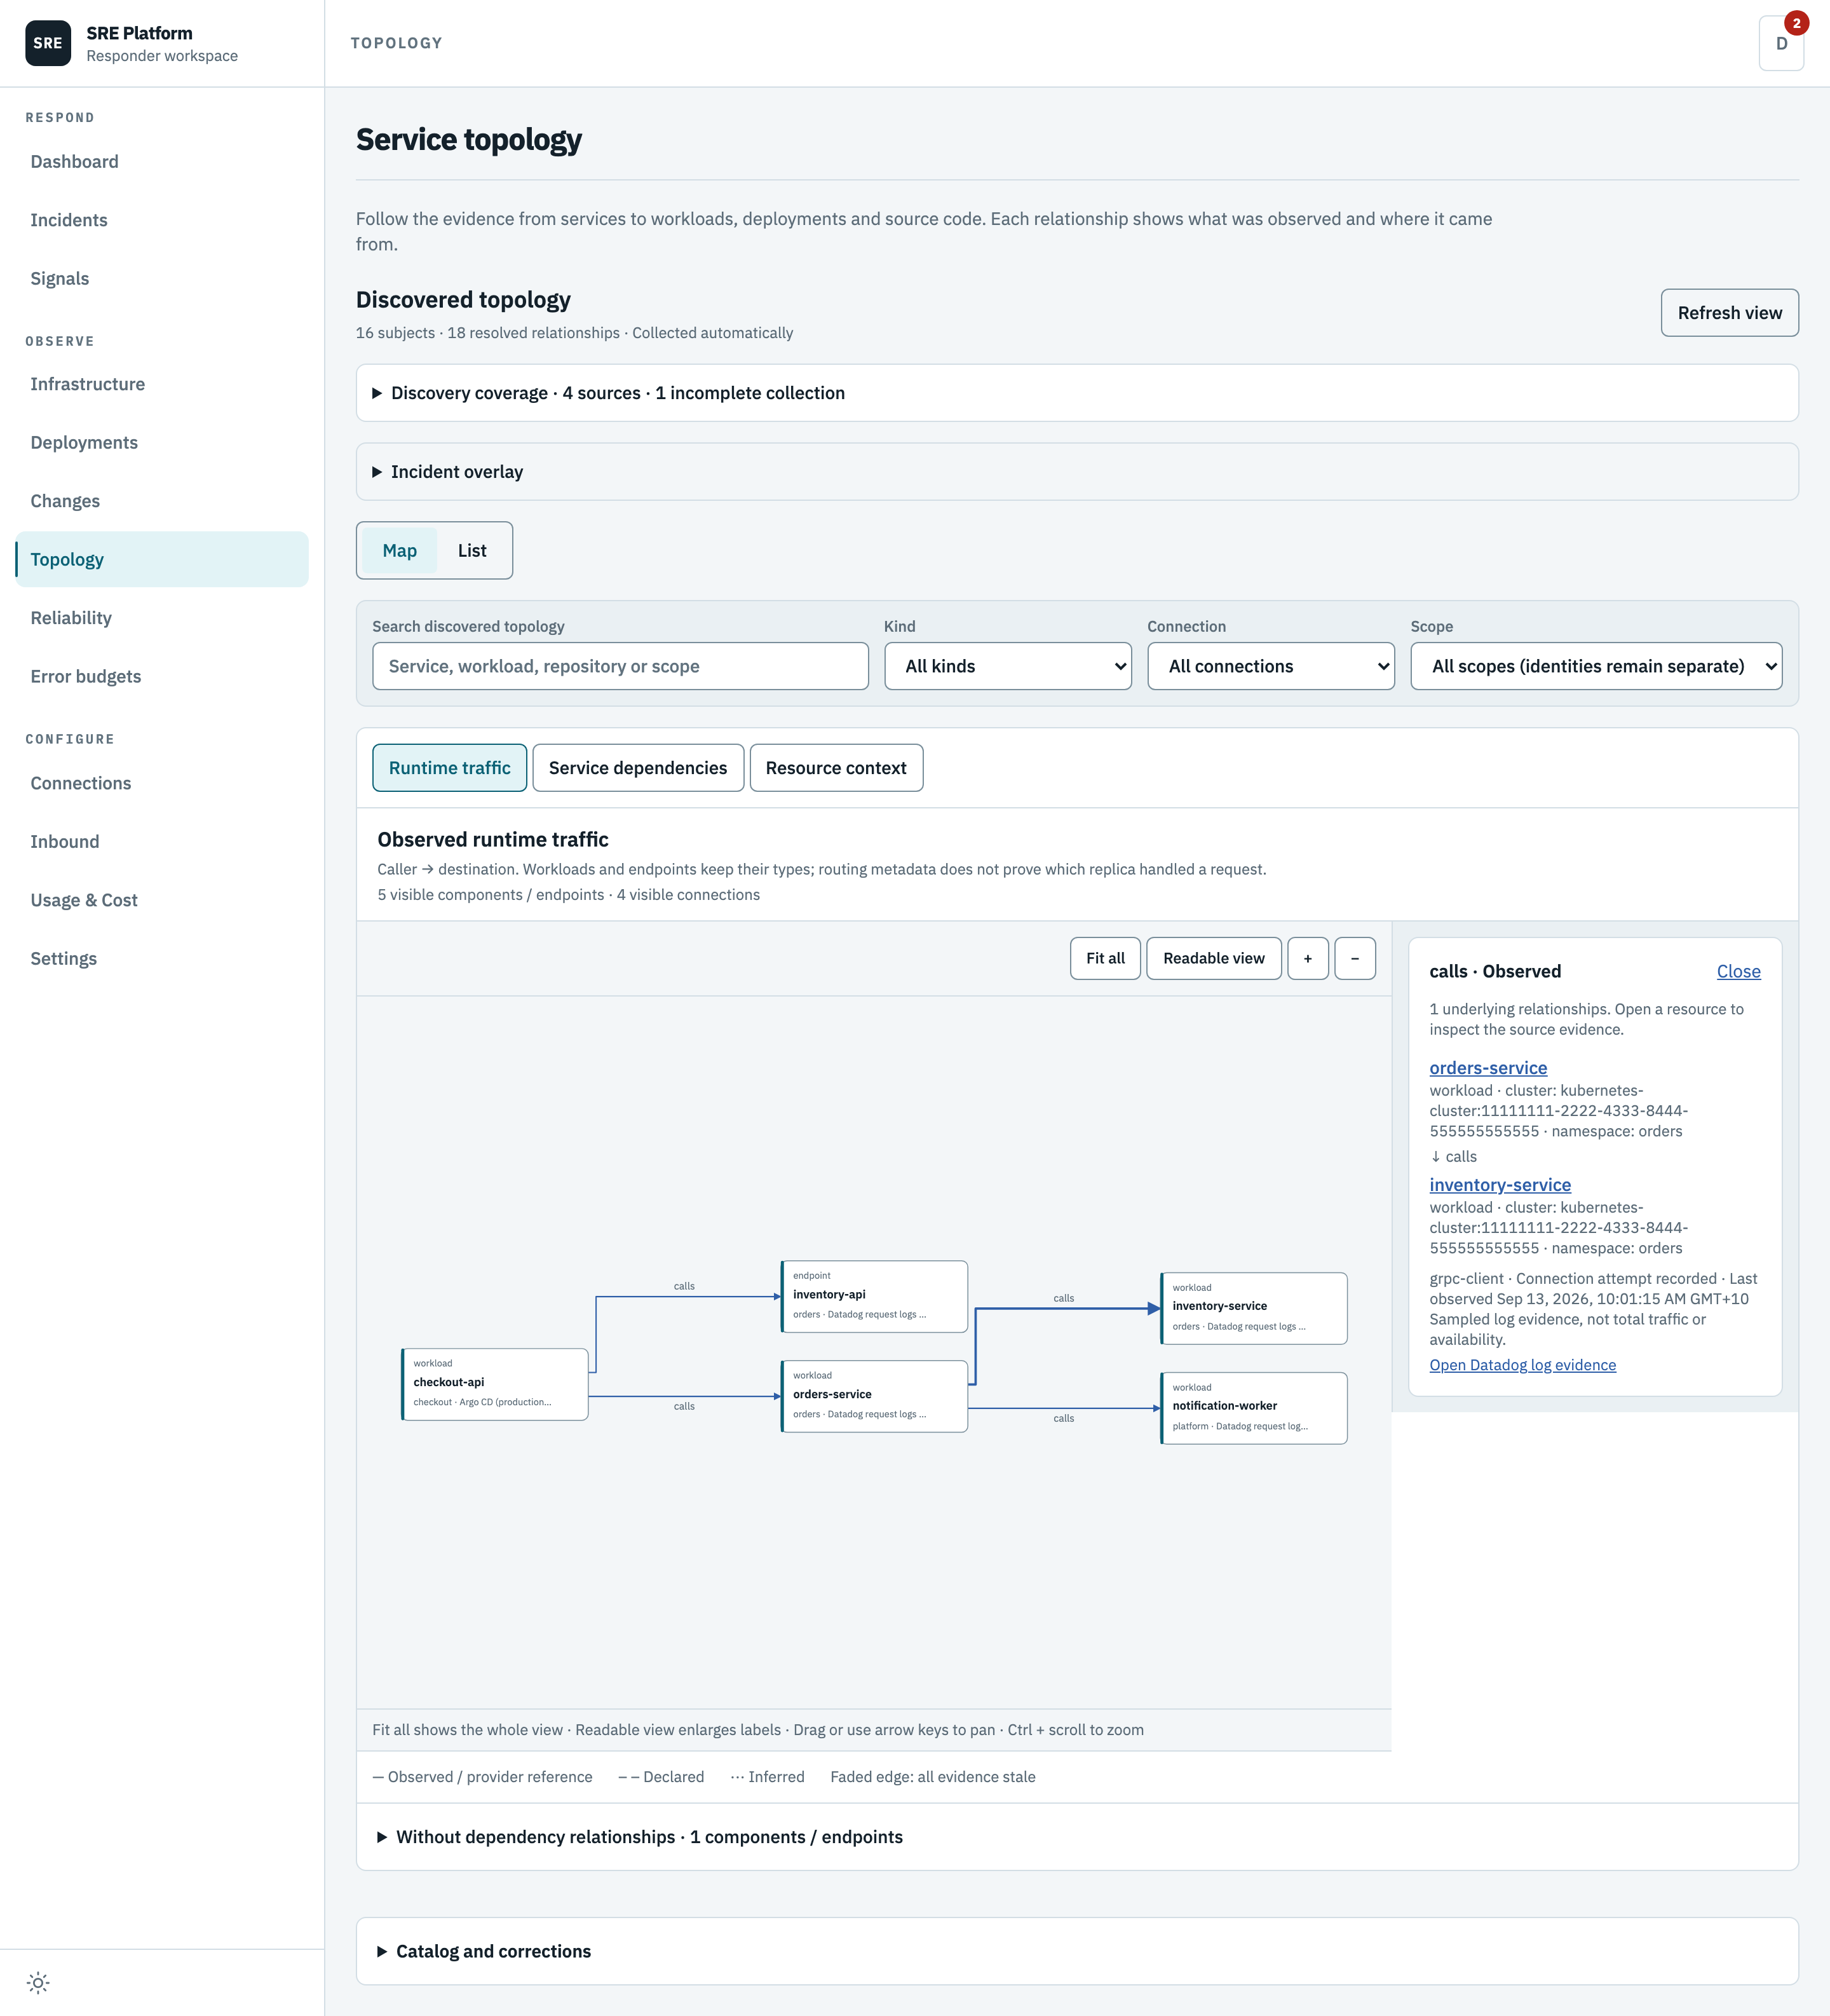
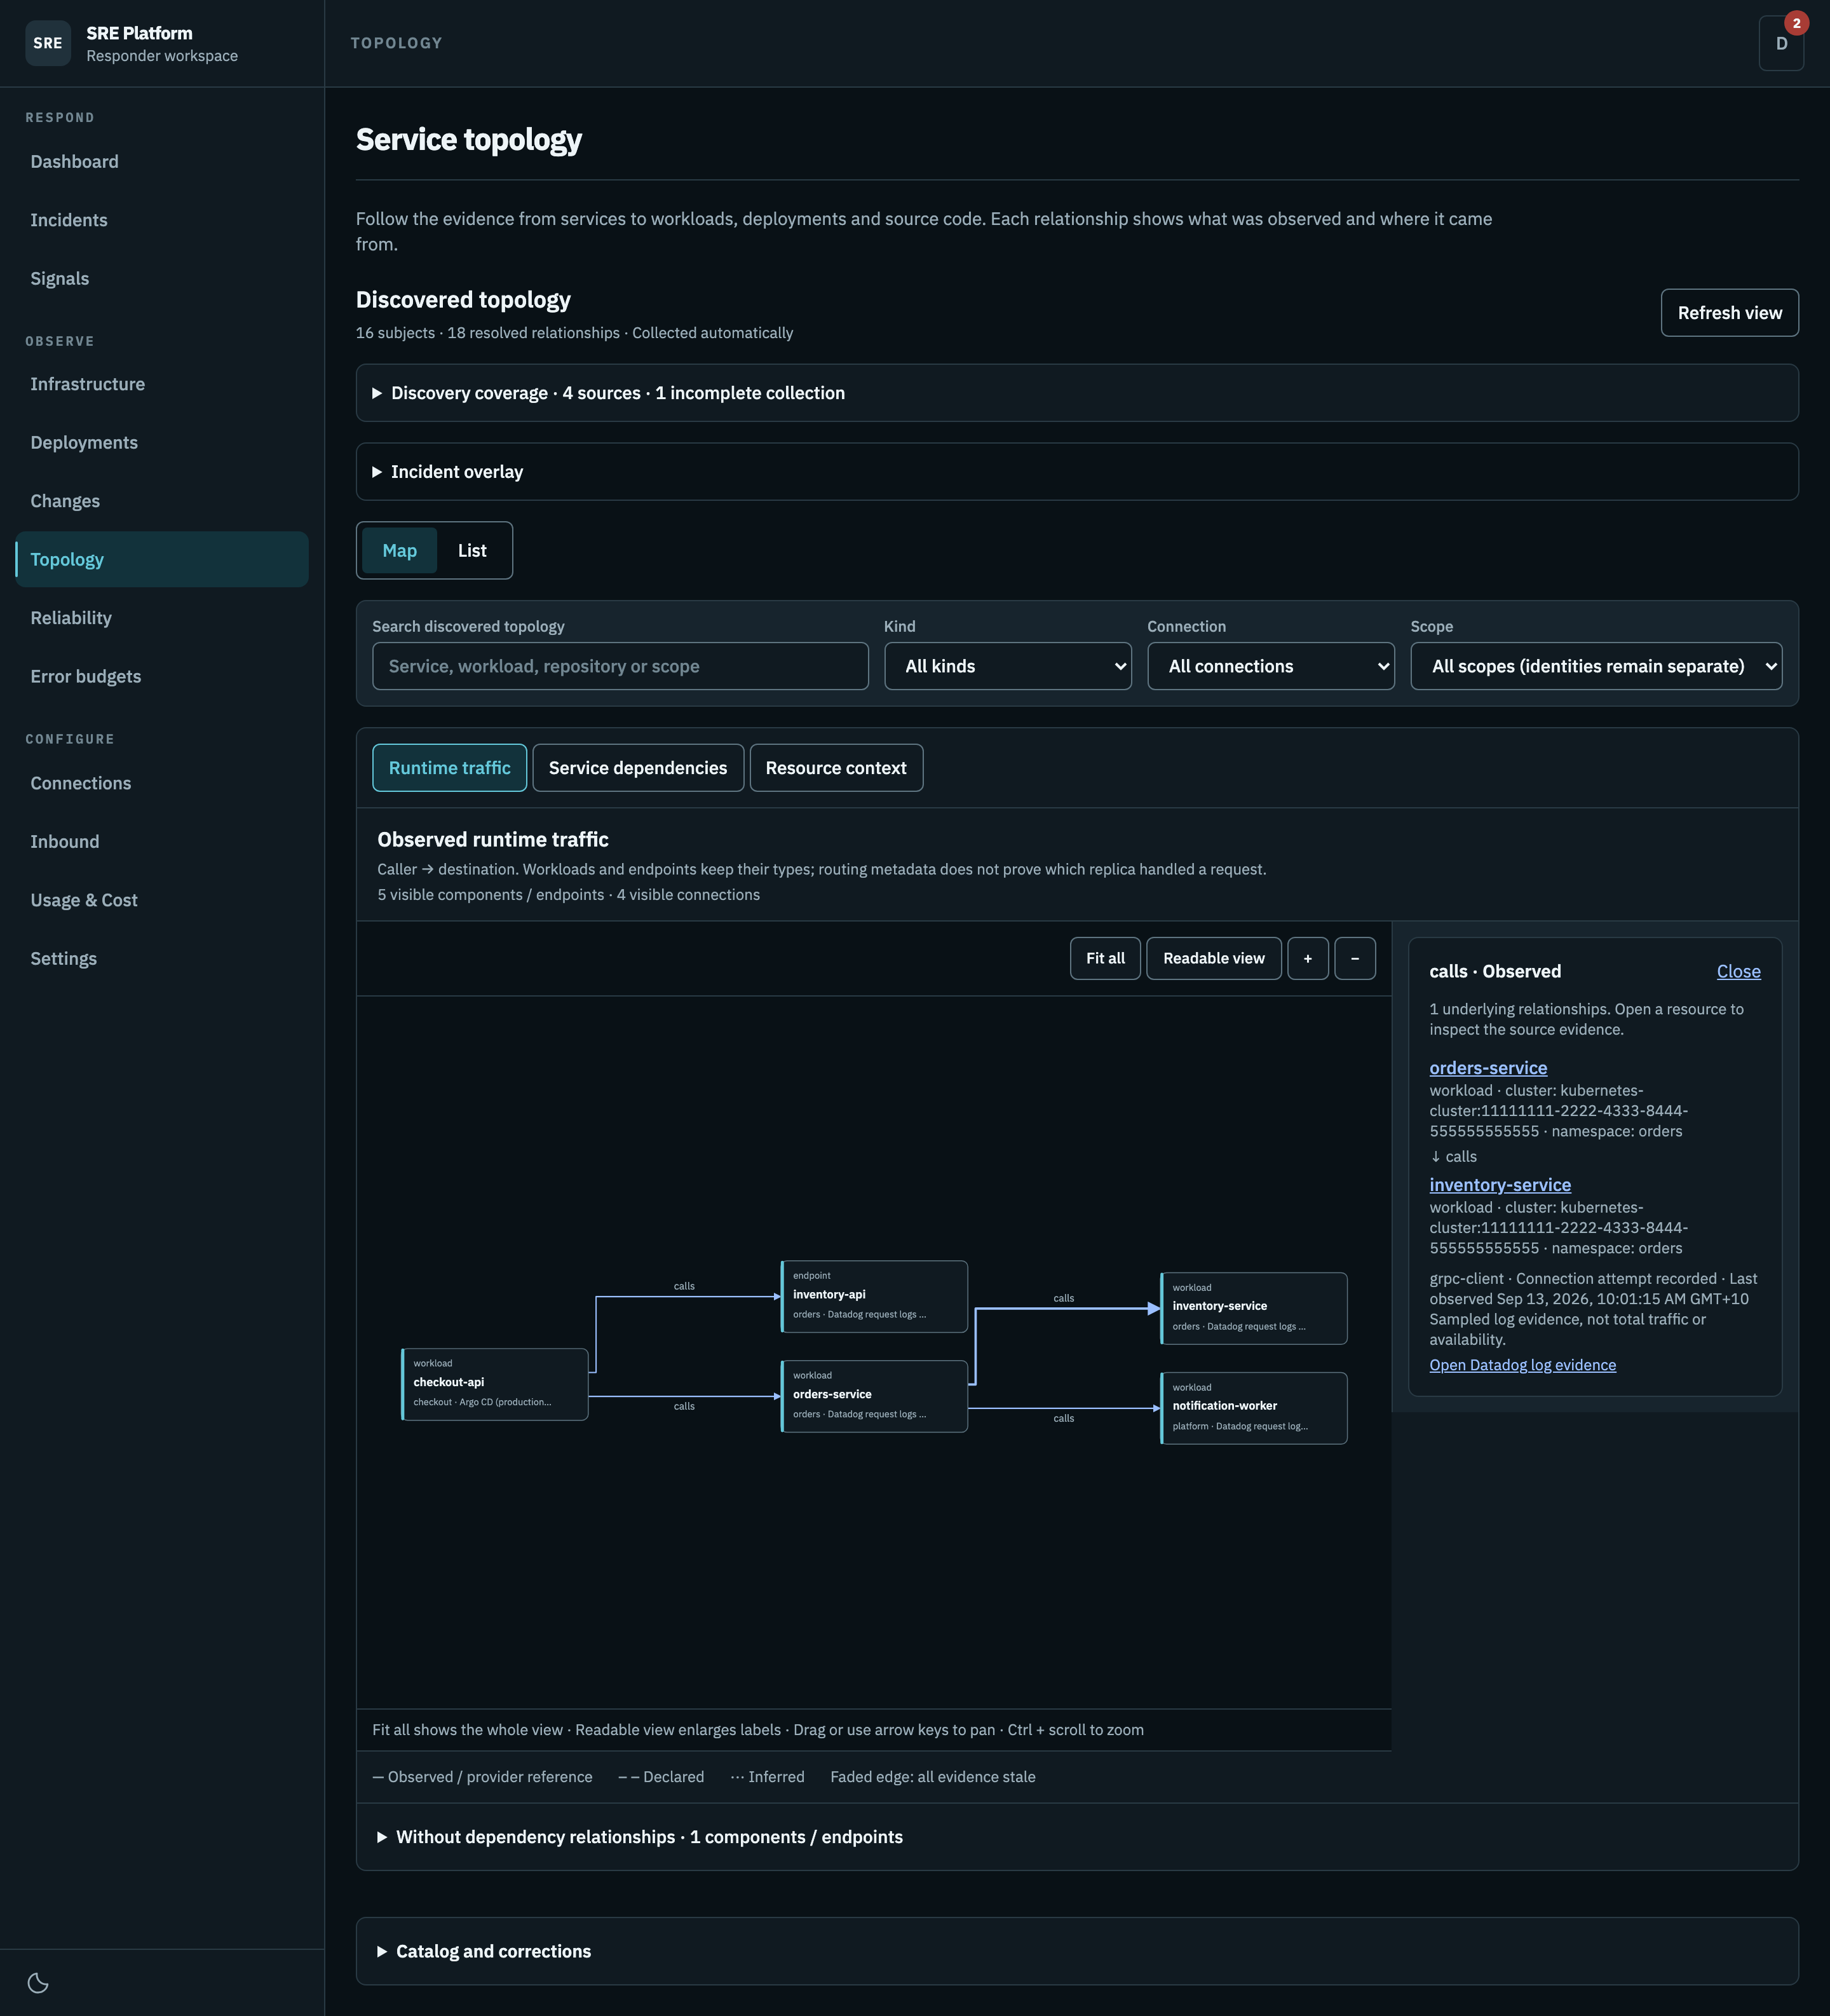
Optional Datadog log discovery supplies ingress and gRPC request evidence without APM. Kubernetes inventory identifies the endpoints. A new connection may need another collection before earlier requests can be matched safely.
Service dependencies
Runtime calls become service calls only when both endpoints have explicit, unambiguous service bindings. In this seeded example, production and staging remain separate despite sharing a name.
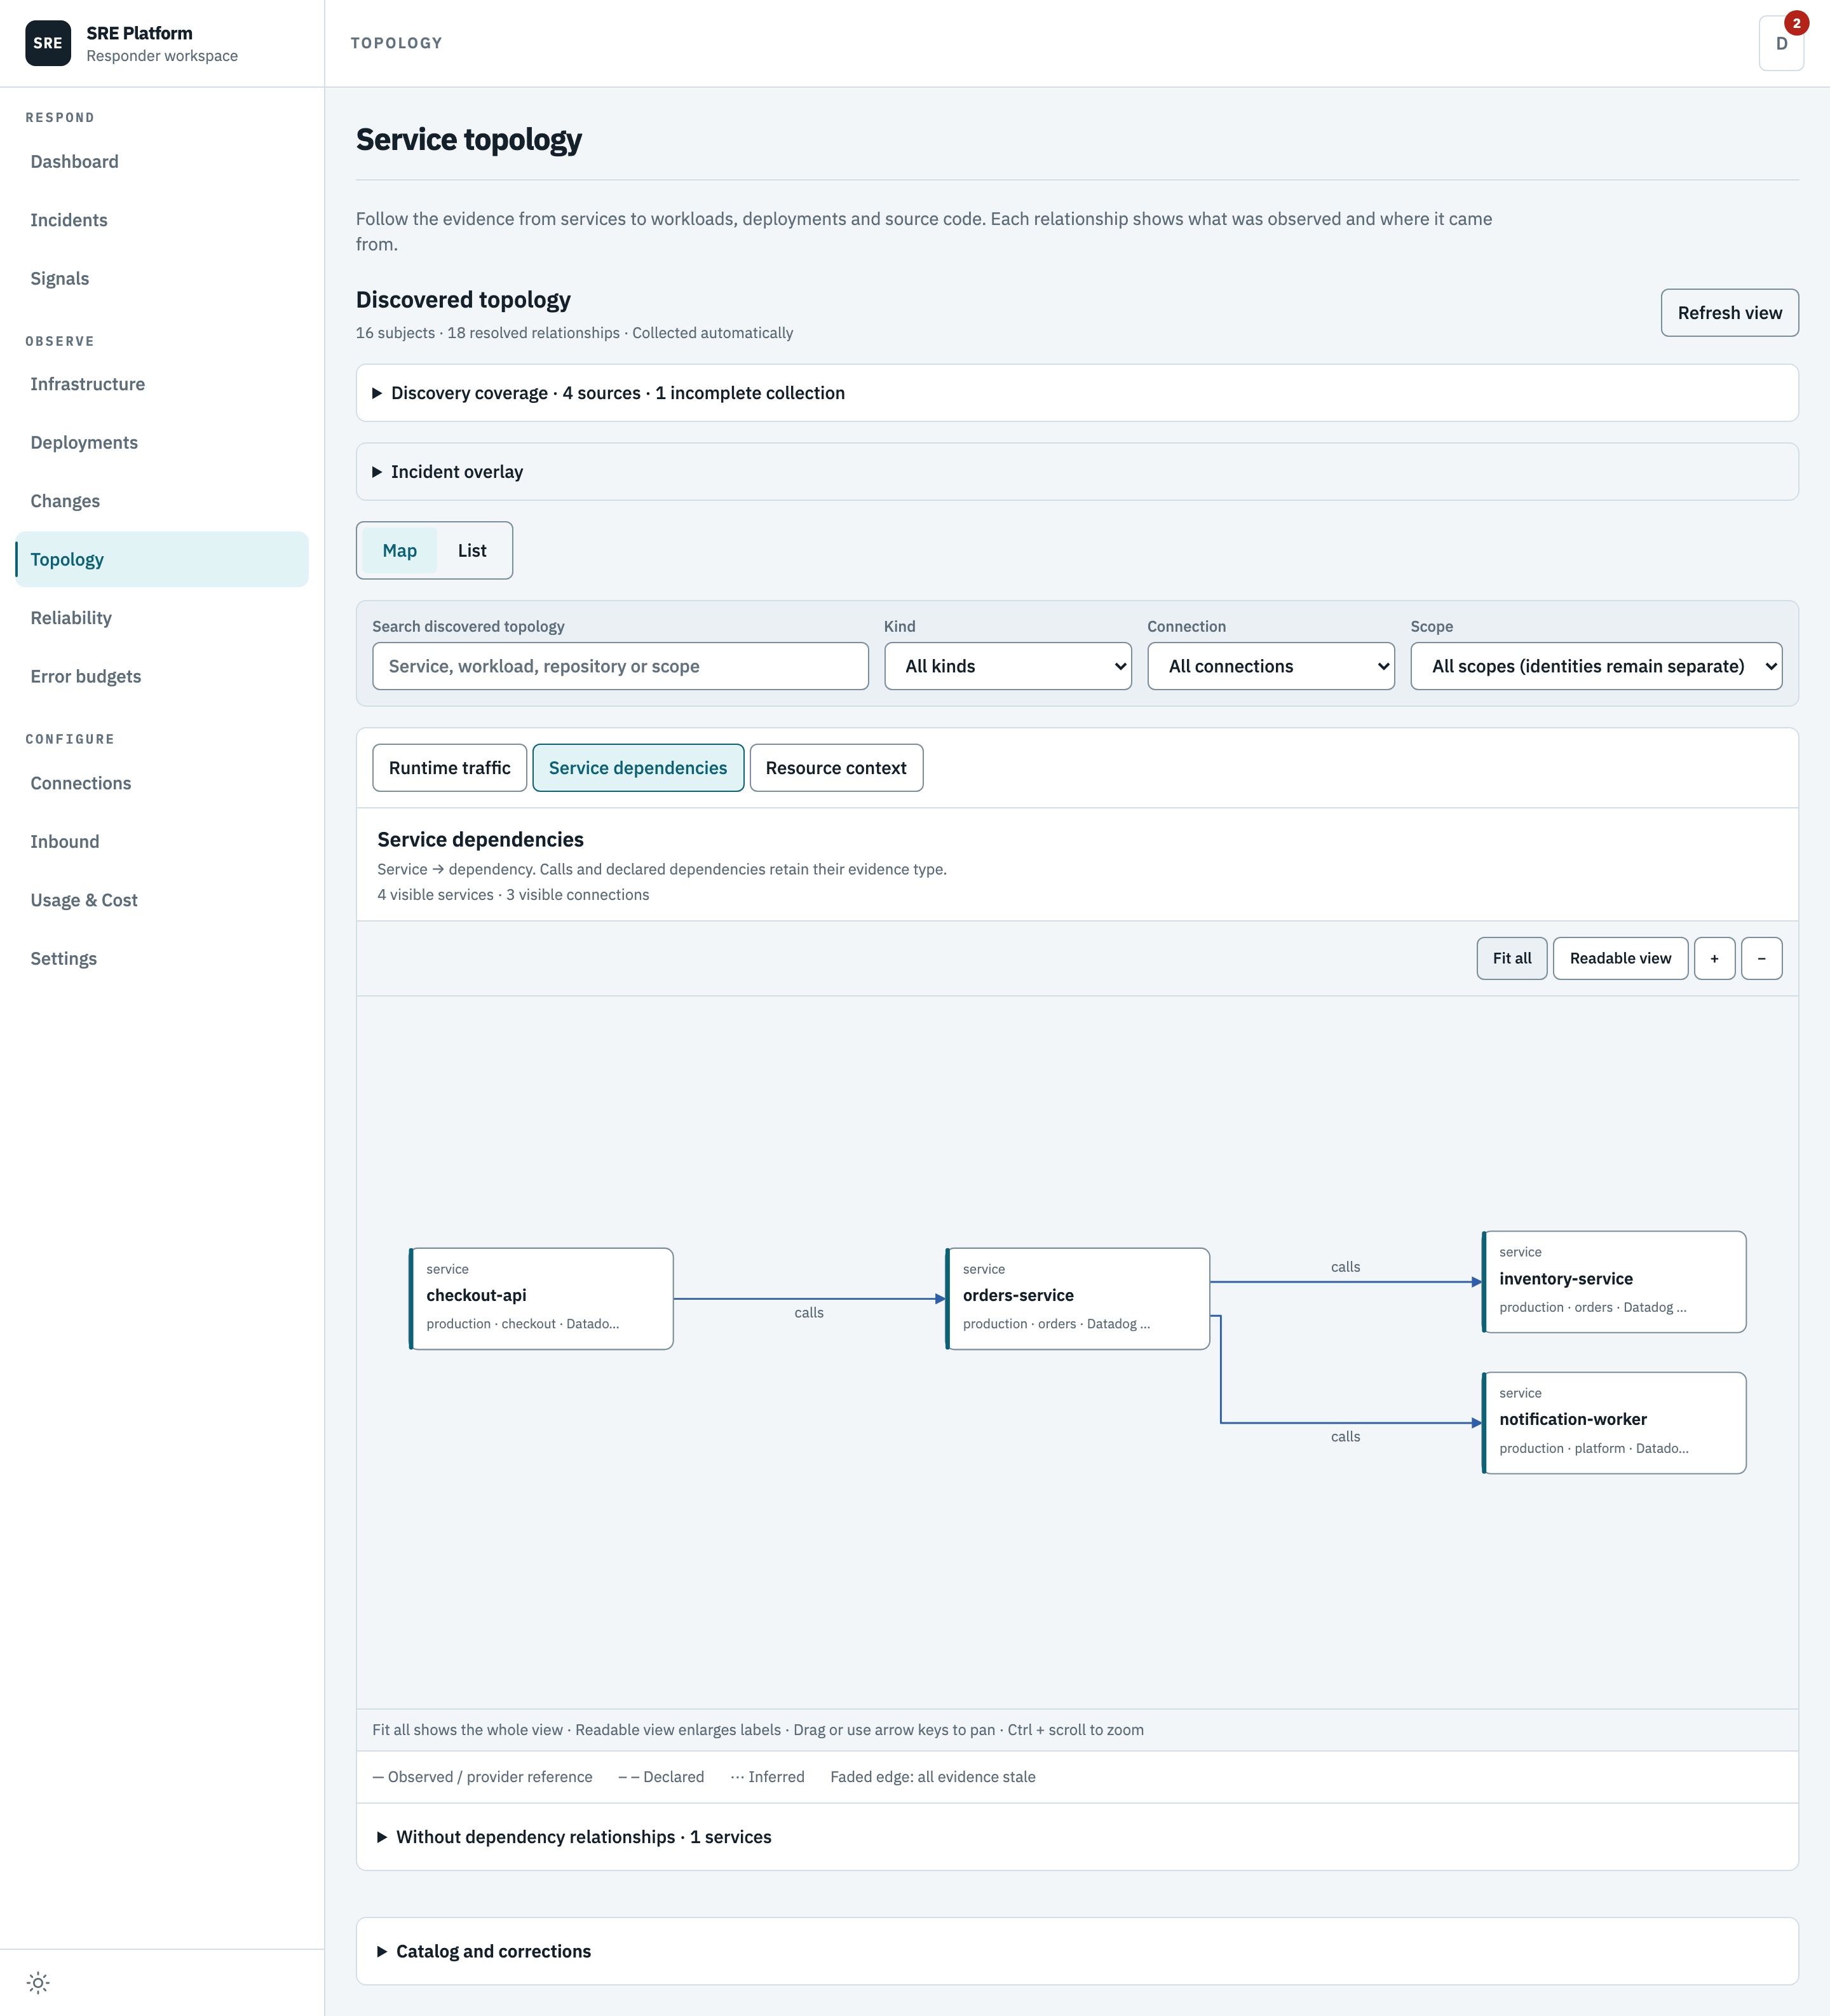
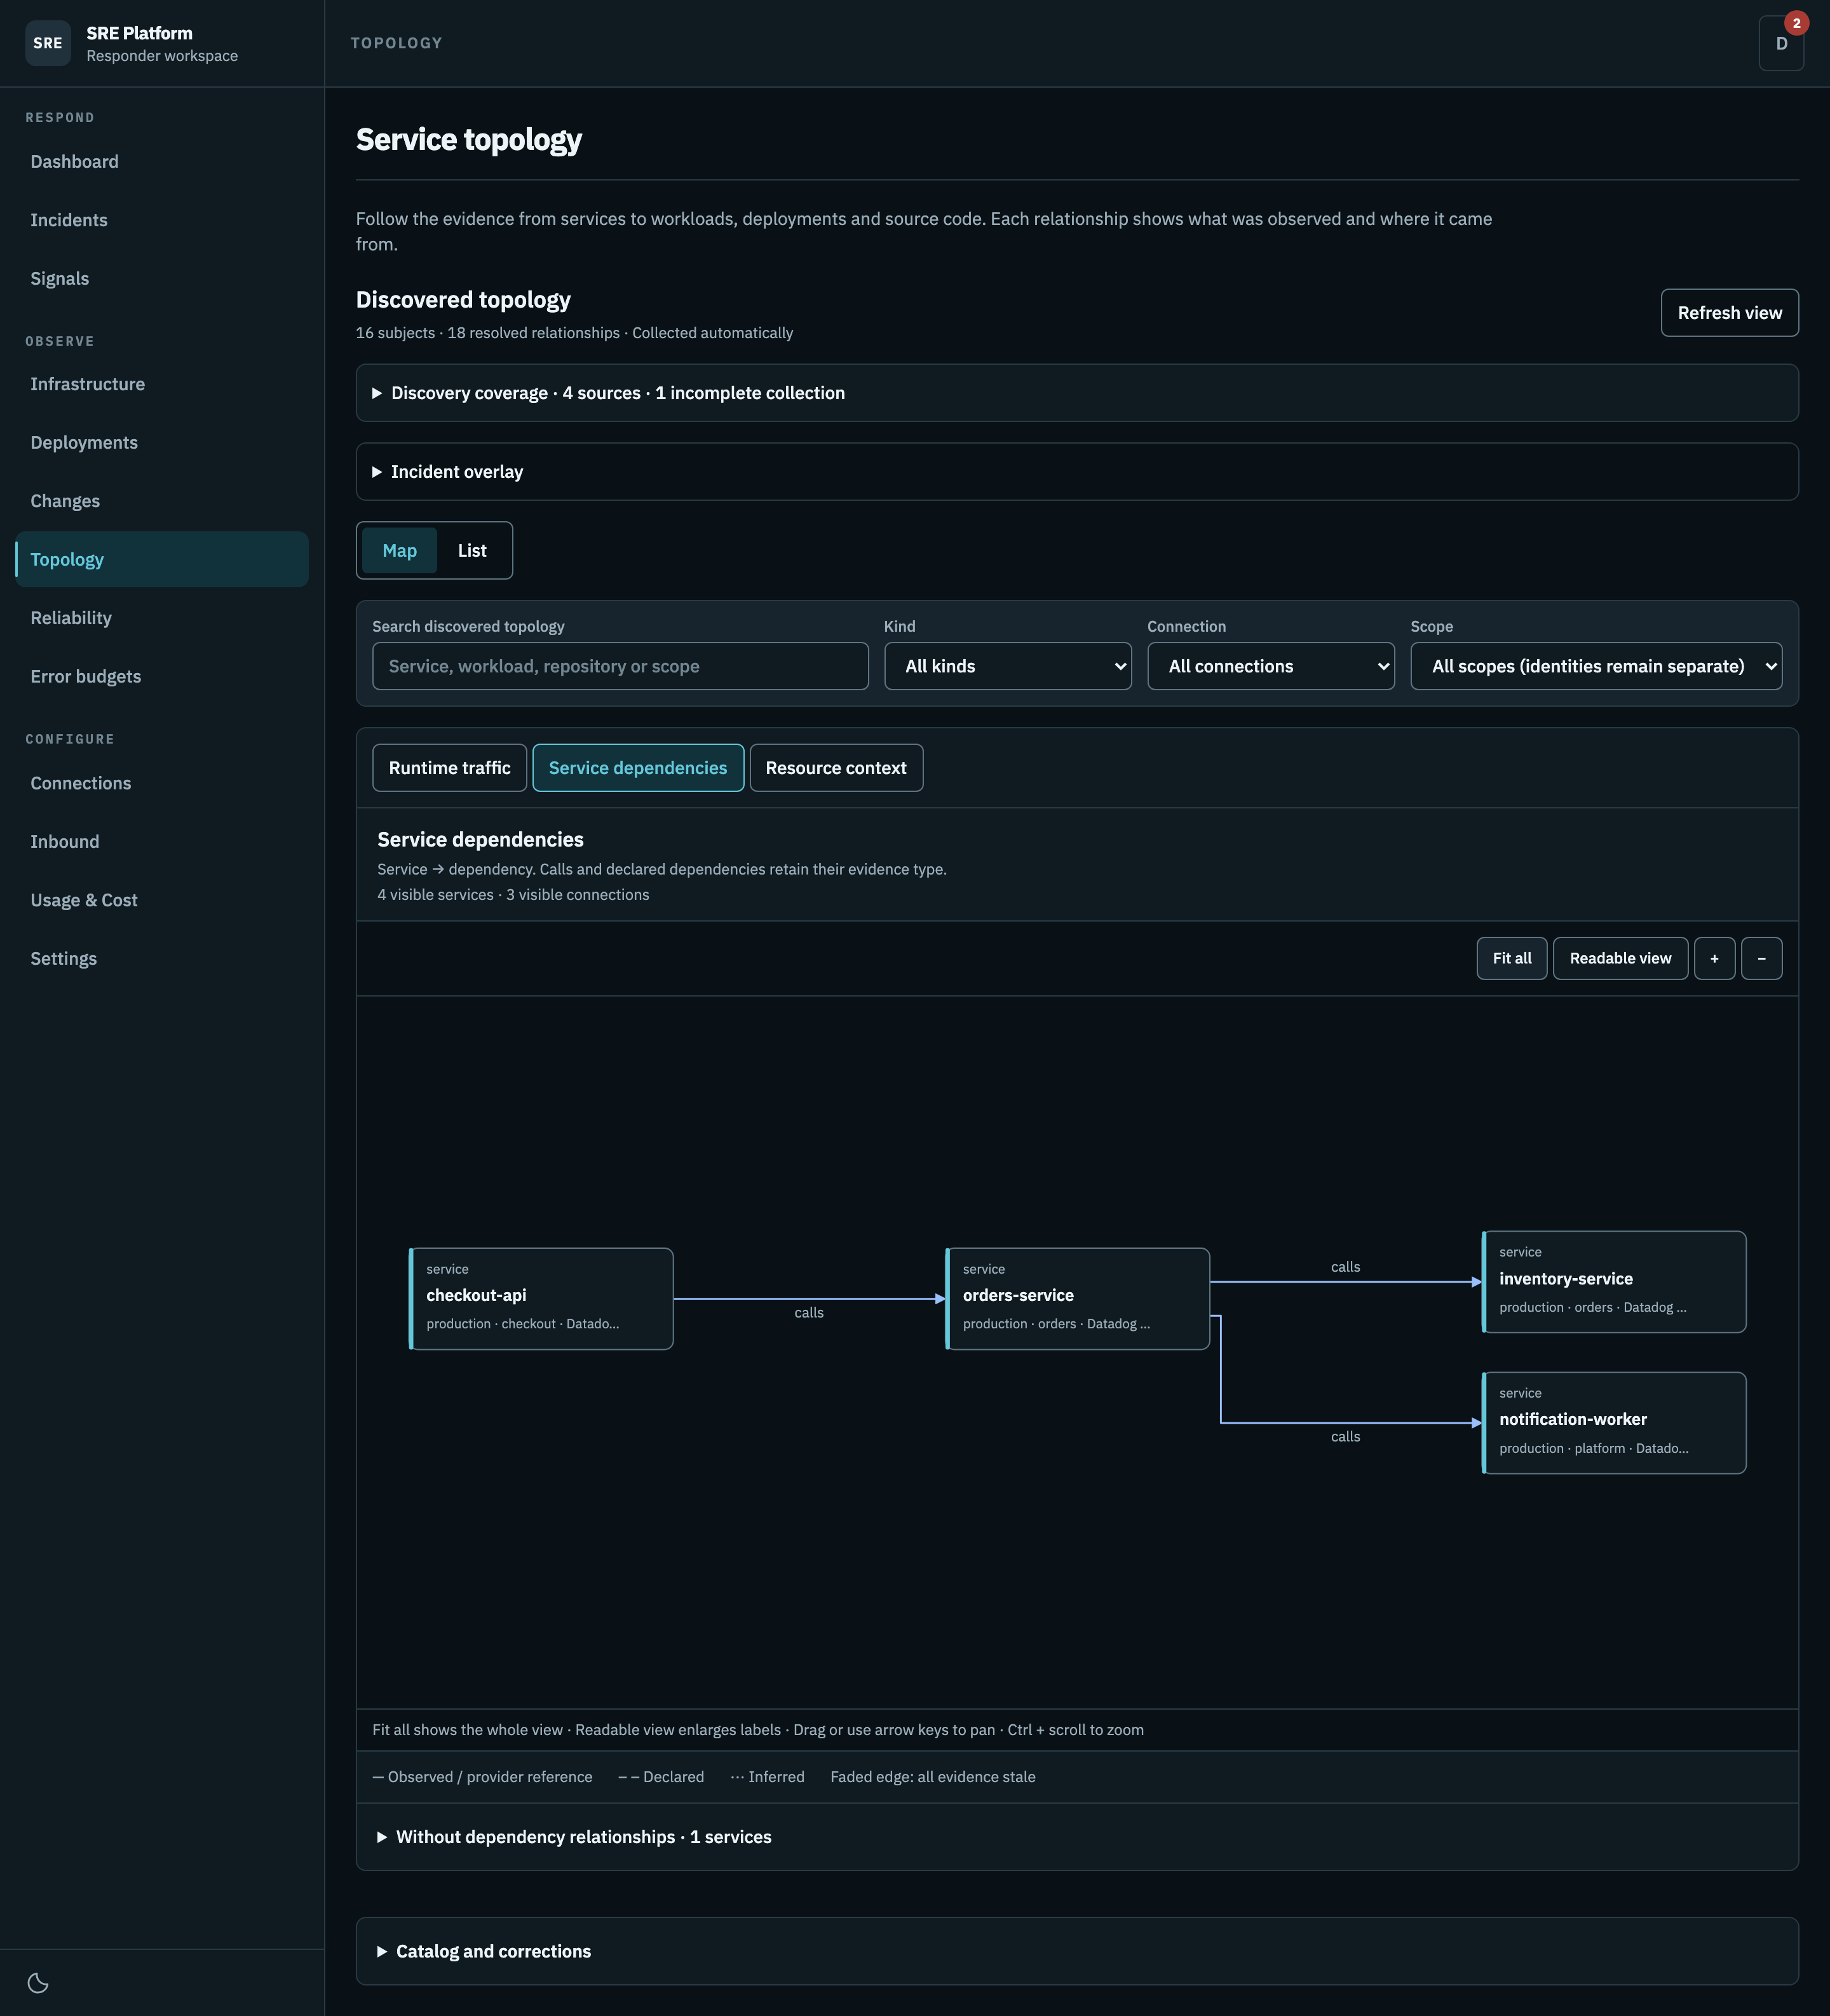
Select an arrow to inspect its direction, source, observation time and coverage. The inspector distinguishes a recorded response from a connection attempt. Samples do not measure total traffic or availability; routing to a pod does not prove that pod handled a request.
Resource context
Open a scope group to inspect its resources. Groups reduce repeated labels without merging identities. Other discovered groups includes groups without cross-scope links.
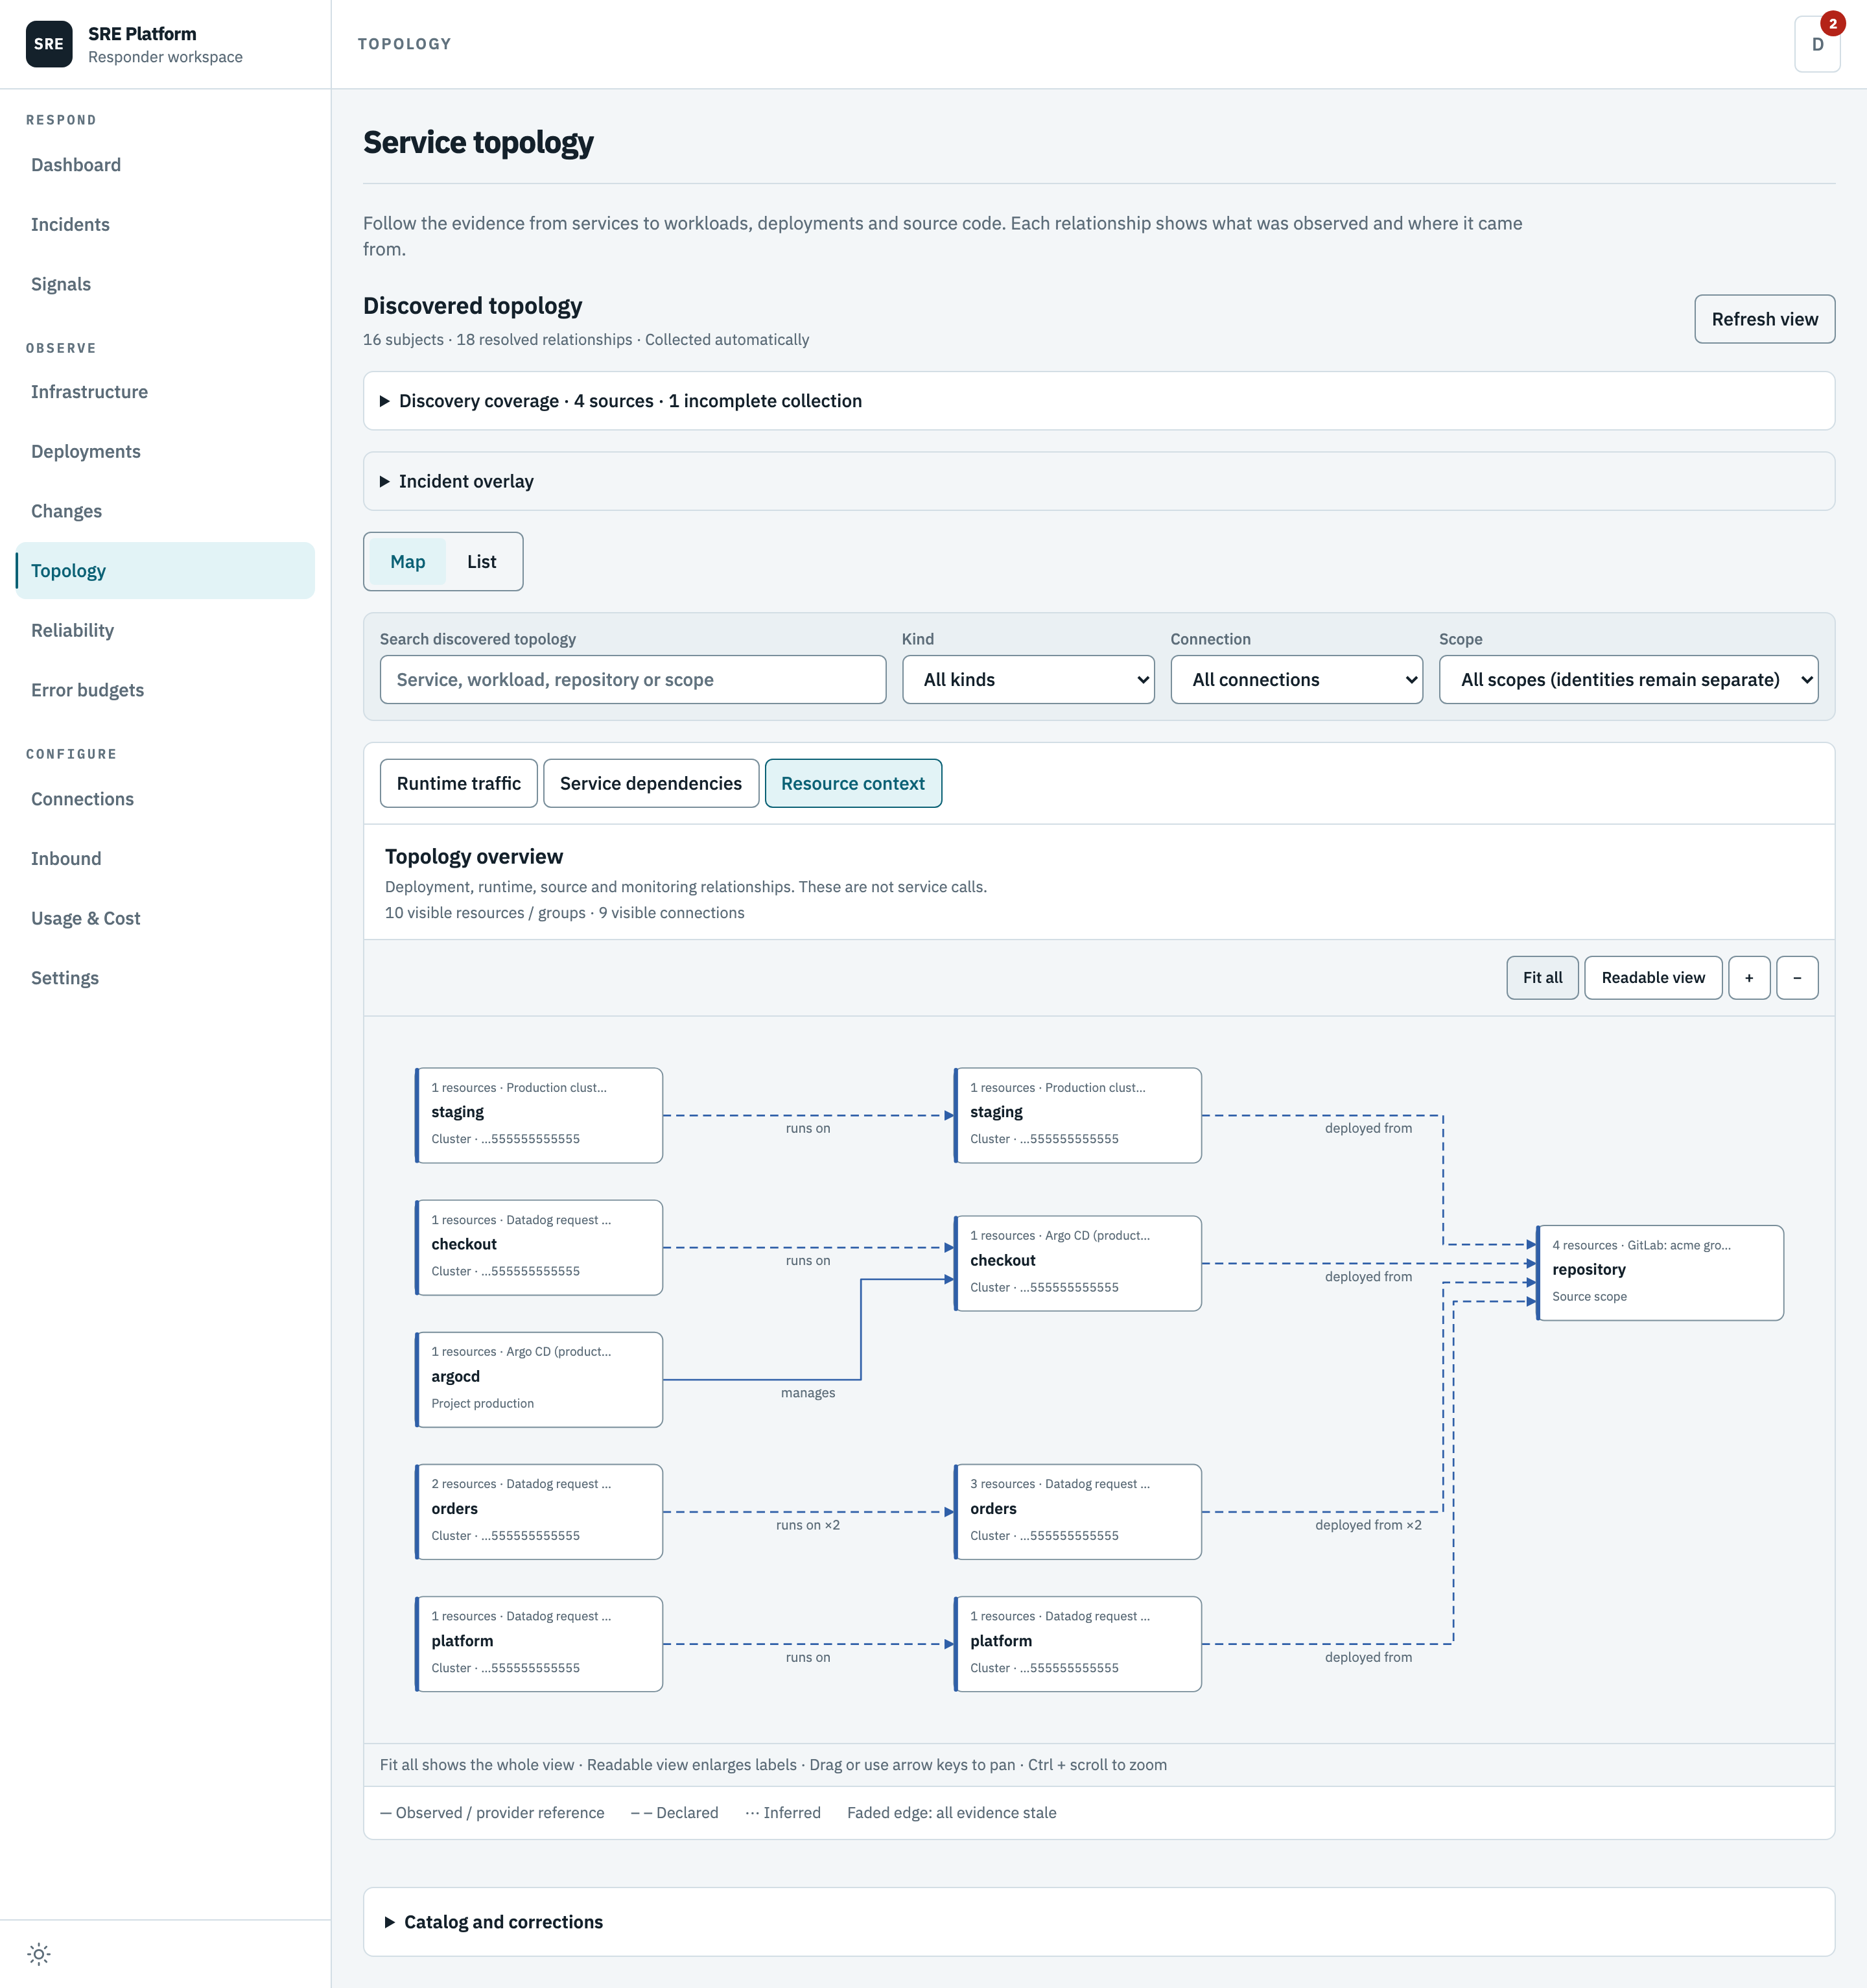
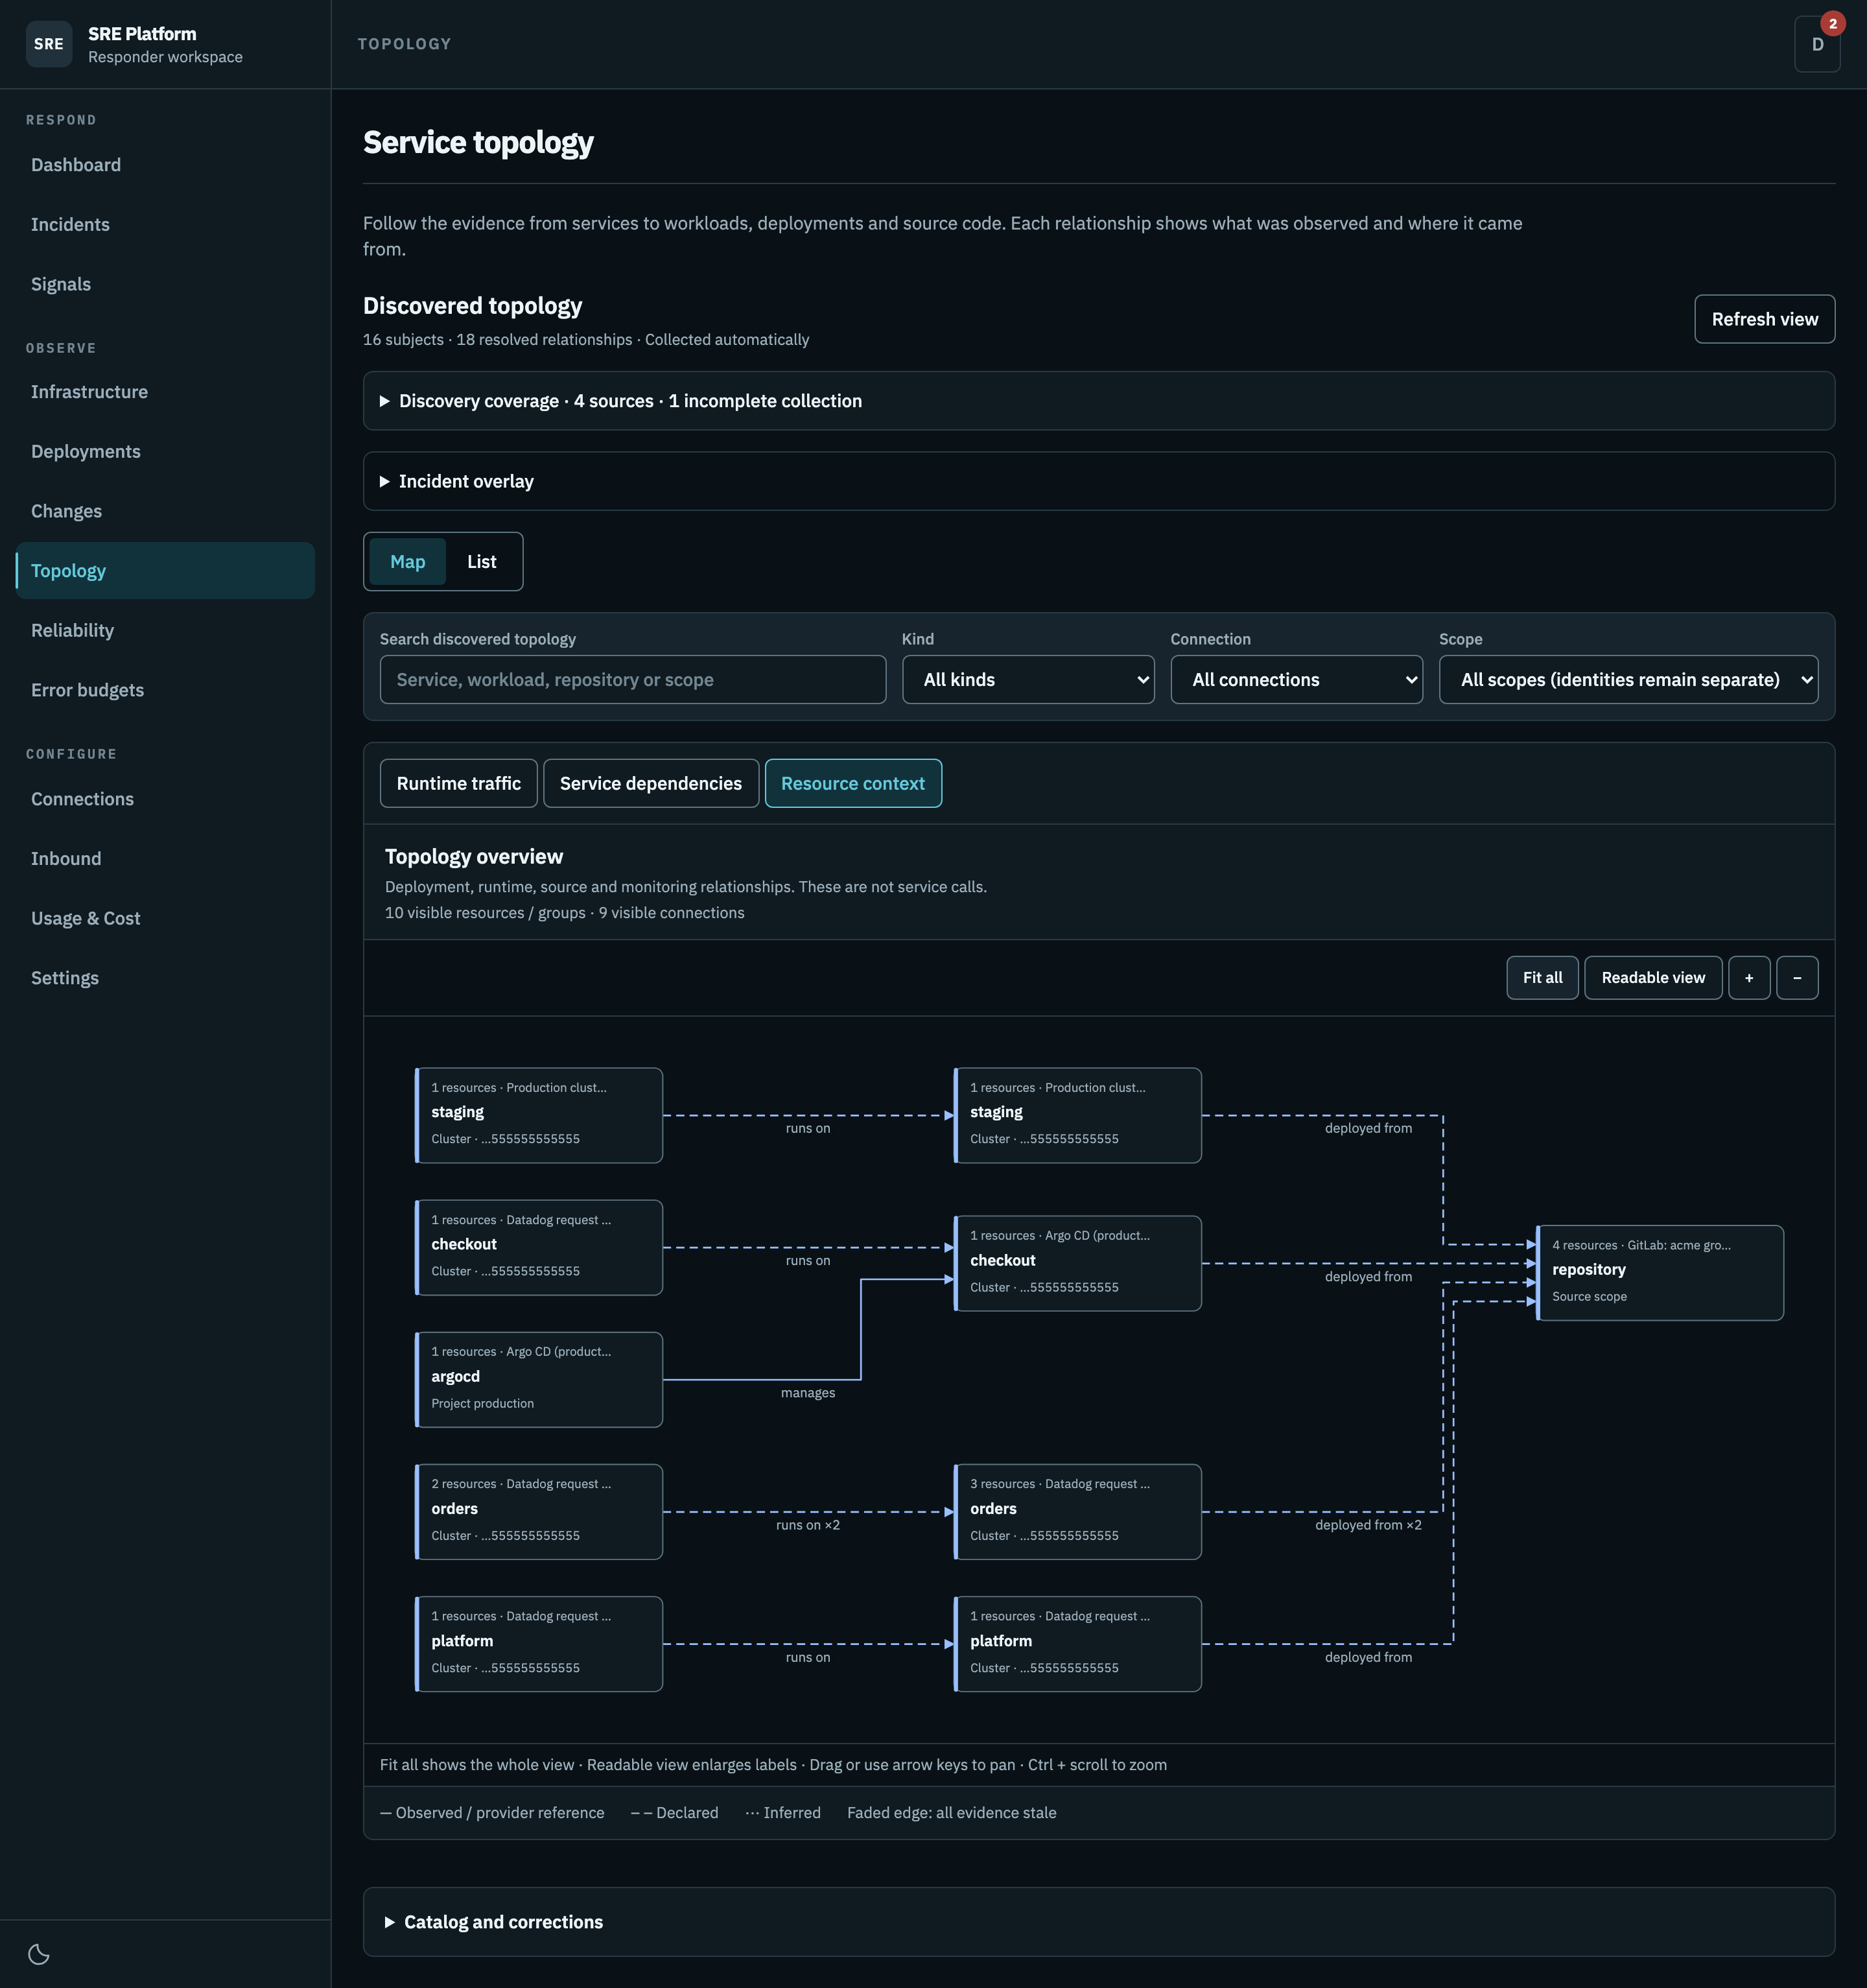
Labels such as runs on, monitors, deployed from and calls describe different facts. Source relationships show their Source role and Recorded revision. A deployment configuration repository is not necessarily application source, and a recorded revision is not proof of the image that ran.
Map controls
- Fit all frames the current map. Readable view enlarges labels; pan to reach off-screen resources.
- Use the zoom buttons or Ctrl+scroll to zoom. Drag the canvas, or focus it and use arrow keys to pan.
- Select a resource to focus its direct relationships. The inspector opens beside the map on wide screens and below it on smaller screens. All groups returns to the overview.
- The map starts with up to 20 resources or groups. Show more connected resources expands it; use filters or List for larger inventories. List remains available if map layout fails.
Arrowheads mark the destination. Solid lines represent observed or provider-reported evidence; dashed lines represent declarations; dotted lines represent inferred evidence. An edge fades when all its evidence is stale. Expand a group to see its internal relationships.
Check discovery coverage
Open Discovery coverage for collection status, observation times and failures. Failed collections link to their connection settings. Connection capabilities and pending sources distinguishes sources awaiting collection, disabled connections and unsupported capabilities. AWS and Confluence do not currently provide topology discovery.
Refresh view reloads stored evidence; it does not start collection. Background workers collect sources separately. Failed or partial reads retain earlier evidence within storage limits, without making it fresh. Current relationship evidence must be within the past ten minutes. Missing samples do not prove a dependency disappeared.
A successful metrics connection does not guarantee access to every discovery API. For Datadog, check the optional APM and log settings, permissions and available data. An empty successful collection is different from a rejected query.
For HTTP endpoints, Endpoint probe evidence shows stored DNS, TCP, TLS and HTTP checks with links to their investigations. Refresh evidence reloads those records; it does not send a probe.
Inspect observed runtime
Select a resource and open Observed runtime. Kubernetes observations match by namespace and immutable object identifier, not similar names. The section refreshes automatically; Refresh runtime checks the latest stored observations. Expand Observation evidence for provenance or Coverage limits for gaps.
Current unhealthy resources can support an investigation. Select Investigate, review the evidence and model-cost notice, then confirm Start investigation. Open investigation returns to an existing active investigation. Stale or unavailable observations cannot start a new one; healthy samples alone do not resolve an incident or prove service recovery.
Source-file reads stay inside an admitted repository's component path at the recorded immutable revision. Excerpts are redacted and bounded. If access or the association changes during a read, the result is discarded; refresh source evidence before trying again.
Incident scope
Open Incident overlay and choose an incident in Incident scope. Matched identity identifies an exact topology match; Possible match remains an uncertain candidate. Inspect opens its evidence without assigning it to the incident. For services, Dependency impact uses that same scoped identity.
Refresh incident matches rechecks the selection. A failed refresh keeps the previous results with a warning and disables inspection and correction until access is rechecked. Catalog correction is an optional manual assignment, not a prerequisite for automatic matching.
Dependency impact describes potential exposure, not confirmed outages. Dependency behavior unknown means synchronous or asynchronous behaviour is not established. Async calls and declared circuit breakers do not prove protection. See the topology model.
Catalog and corrections
Use this optional section to record ownership, known dependencies and manual corrections. No manual catalog entries does not mean automatic topology is empty.
Workspace owners and administrators can edit the catalog, runtime mappings and incident service assignments. Members can read the topology and its evidence.
Register and map runtime
- Open Runtime mapping. Choose a connection and namespace, enter or select a service, and set its environment.
- In a shared namespace, select an application label. Select all pods only if the whole namespace belongs to that service. Record the reason for the mapping.
- Choose Register service and map runtime for a new service, or Confirm runtime mapping for an existing one. Use Edit catalog to add ownership and criticality.
Editing a saved mapping changes its service, environment and reason. To change its resource selector, remove it and add a new mapping. These actions do not modify or delete cluster resources.
Check evidence before trusting health
The catalog's Runtime evidence reports coverage for each connection, including empty results.
| Status | Meaning |
|---|---|
| Active incident | An active incident is associated with the service |
| Needs attention | Mapped runtime includes an unhealthy observation |
| Stale | Runtime observations are too old |
| Runtime healthy | Mapped pods look healthy and collection is complete |
| Evidence incomplete | Runtime evidence cannot establish complete coverage |
Runtime health is not service availability. Service details show reliability objectives, their SLI queries, evaluation times and failures. Missing objectives or evaluations mean reliability is unknown.
Inspect dependencies
In Edit catalog, register both services, then choose a caller and dependency under Service relationships. Record the environment, call type, optional protocol, declared breaker and reason. Saving confirms a human declaration; it does not verify live traffic.
For checkout → payments, checkout calls payments. A payments failure may expose checkout.
Relationships can be edited or removed with confirmation. Remove relationships and runtime mappings
before deleting their catalog service.
Navigate the catalog
Environment, Source, status and service search filter the catalog. All environments combines mapped runtime; unspecified-environment dependencies remain included conservatively. The catalog's map uses Fit services, Reset view and Show selected service and direct neighbors.
Select an incident and choose Link affected service or Edit affected services to assign catalog services with a reason. Restore provider mapping removes that override. Assignments take precedence for that incident without rewriting its original signals or starting an investigation.
Reported deployment matches are name-based candidates, not confirmed runtime identities. Deployments without an environment do not match a specific environment filter. Investigations started from the catalog read all confirmed runtime scopes, not just the displayed environment.
Review history
Open Review declaration history, choose a date and time, then View recorded relationships, or select a recent version. History shows retained declarations, not historical runtime health or current impact. Times before tracking began have no recorded evidence. Select Return to live topology to resume editing.