Dashboard
The landing page. It answers one question: what needs a person right now?
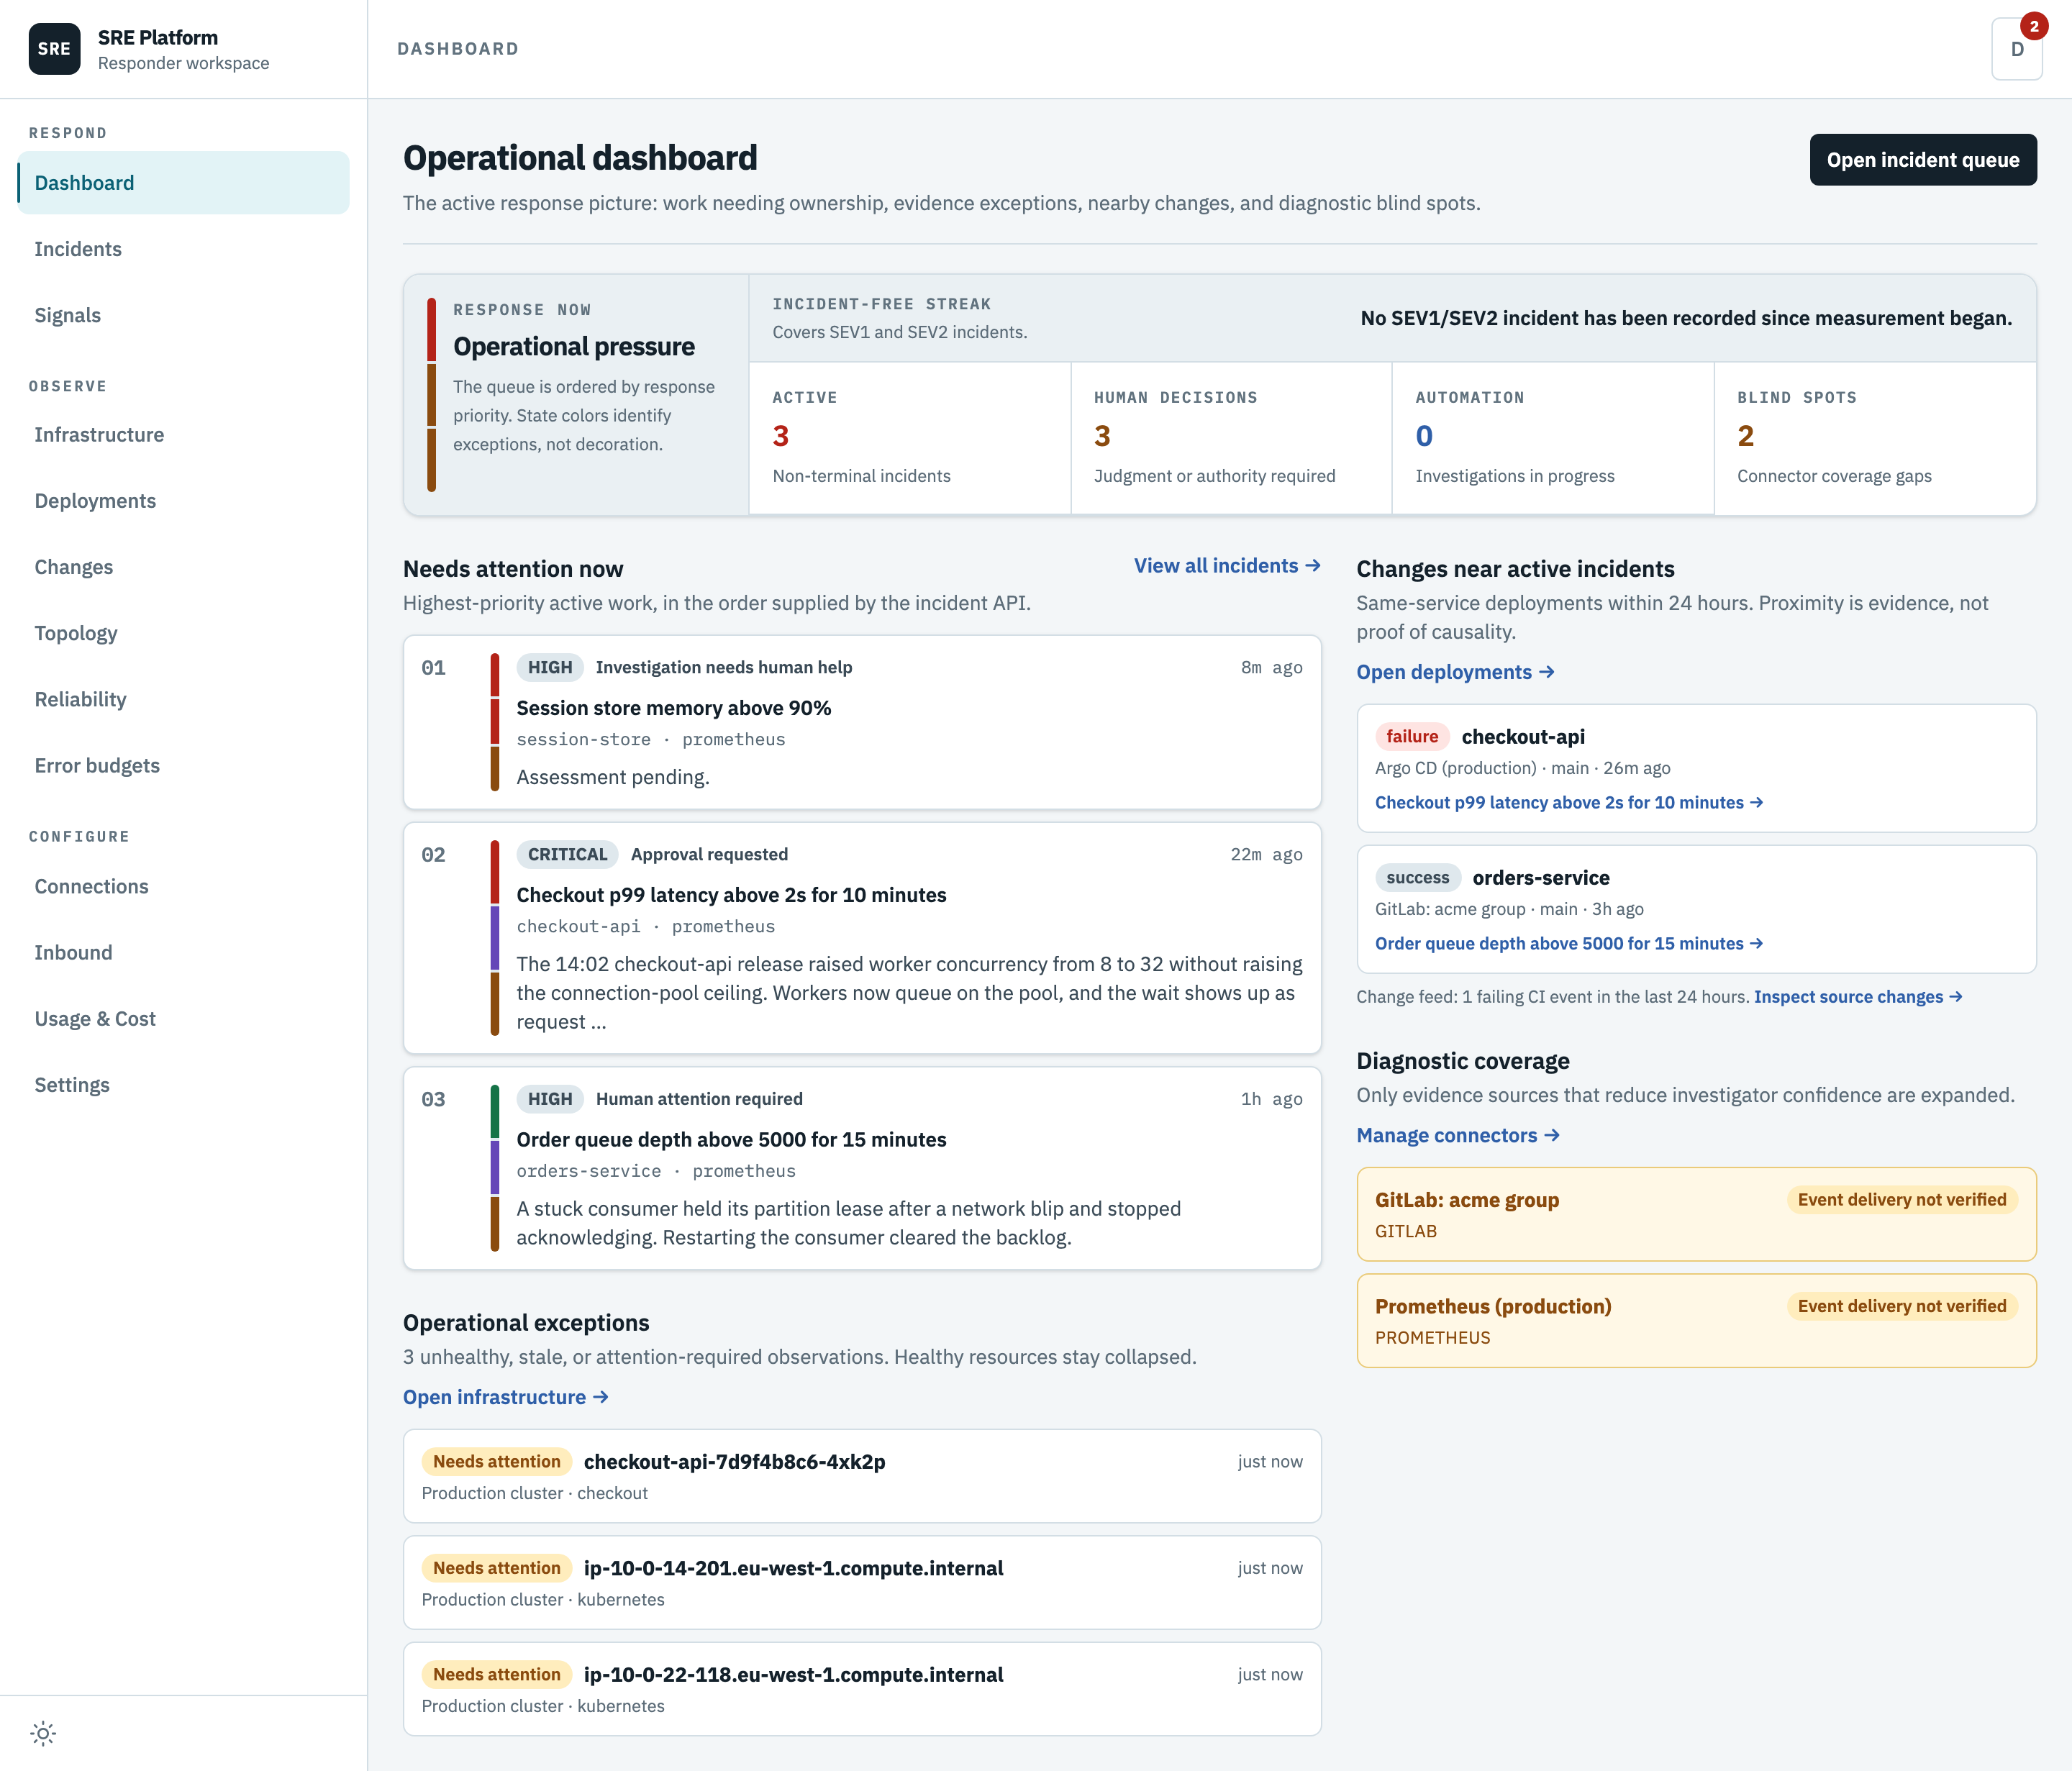
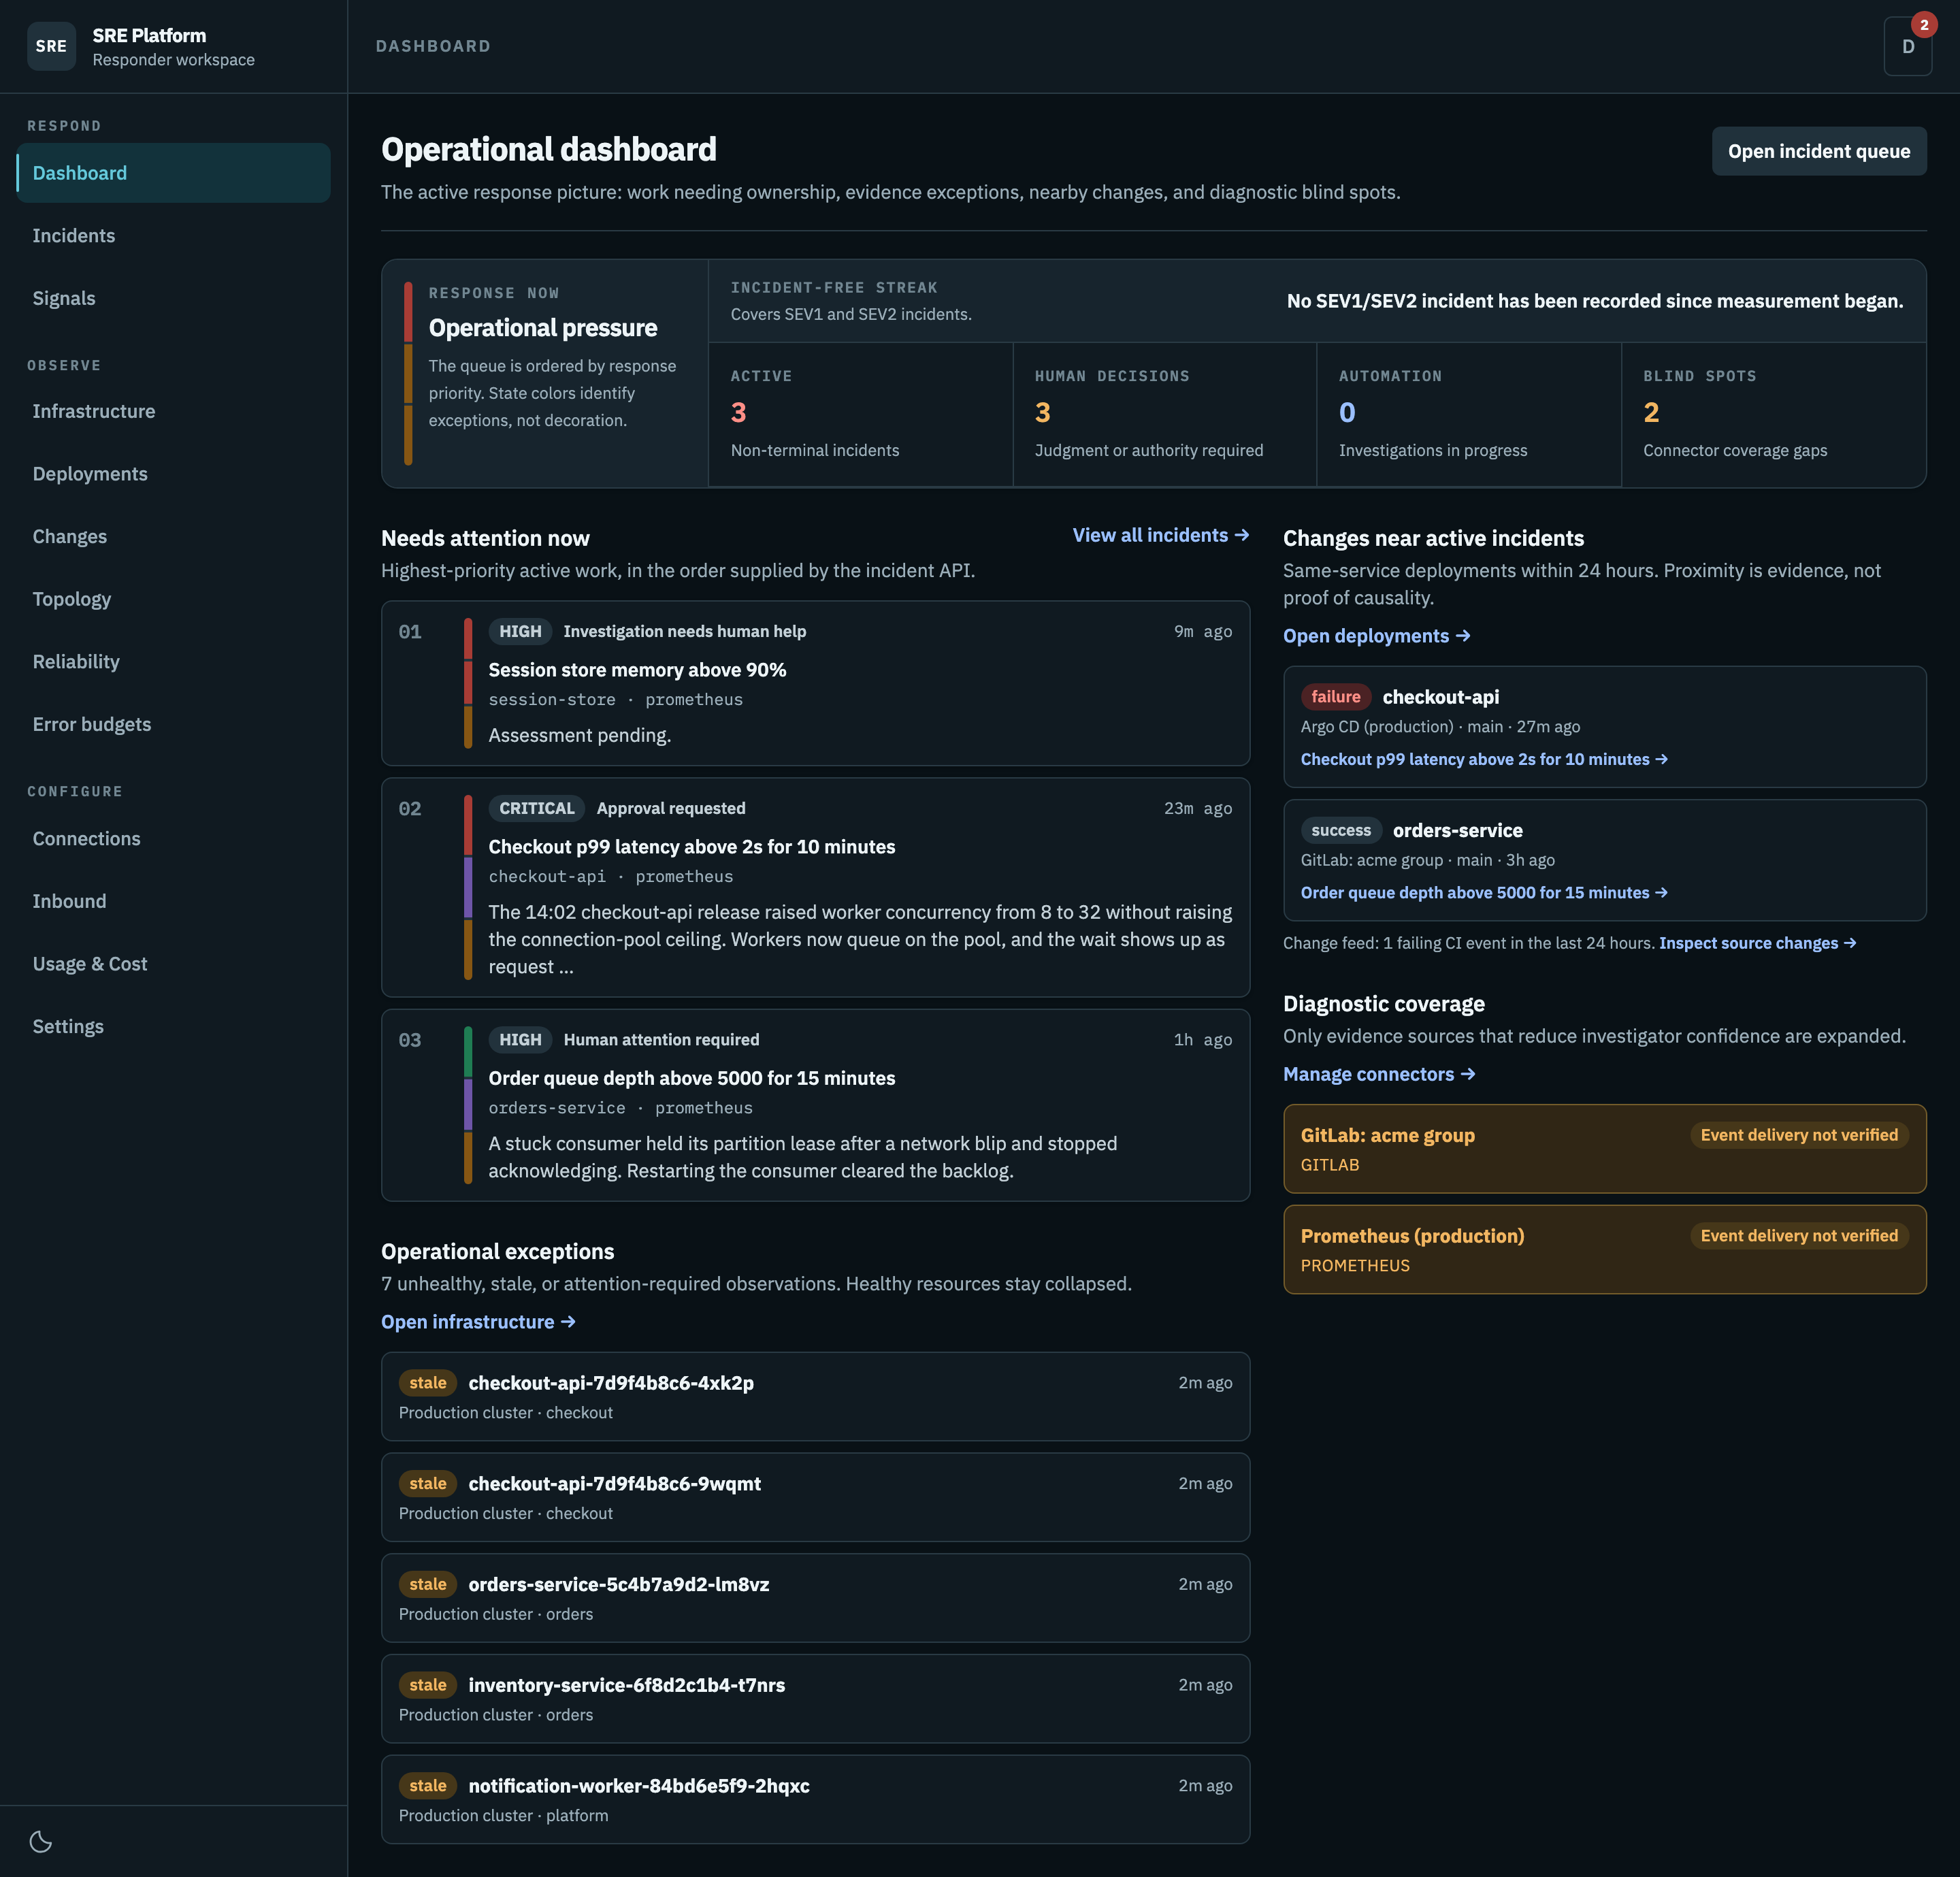
Operational pressure
The band across the top is four counts, not a score.
| Count | Means | Where it comes from |
|---|---|---|
| Active | Incidents that are neither resolved nor closed | Open and mitigated incidents |
| Human decisions | Cases waiting on judgment or authority you have not given | A pending approval, an unverified recovery, an investigation that stopped |
| Automation | Investigations running right now | The engine is gathering evidence |
| Blind spots | Data sources the platform cannot currently read | A failed credential check, or a source that has never delivered an event |
Blind spots matter more than they look. Every one of them is a class of evidence the next investigation will not have, and the platform will lower its own confidence to match.
Incident-free streak
The status rail above the counts covers SEV1 and SEV2 incidents only. Its timestamp comes from the server, while the browser updates the visible duration once per second without polling the API each second.
- Running starts from the most recent qualifying incident's recovery time, or its closure time when no recovery time was recorded.
- Paused means at least one qualifying incident is active, so the dashboard does not claim an incident-free period.
- No history means the platform has not recorded a qualifying incident yet.
- Unavailable means the lifecycle summary could not be loaded; no stale duration is shown.
Archived incidents still contribute to the historical timestamp, but their deleted summaries are not linked or displayed.
Needs attention now
The queue, already ranked. You do not sort it; the ranking is the point.
Each card carries a one-line reason it is in the queue, the service, where the alert came from, and the current assessment in the incident's own words. The coloured bars on the left are states, not decoration.
An incident appears here when any of the following is true.
- An approval is waiting on a person.
- The investigation is degraded, meaning the model provider could not be reached.
- Recovery has not been verified.
- The alert behind it is no longer tracked.
- A mitigation is in progress.
- Recovery is verified but the incident is still open.
- Its severity is above the lowest.
Operational exceptions
Runtime observations that are unhealthy, stale, or need a look. Healthy resources stay collapsed on purpose, so the section shows what is wrong rather than a wall of green.
Changes near active incidents
Deployments to the same service, within 24 hours of an active incident.
The heading is deliberate: proximity is evidence, not proof of causality. A deploy that lines up in time is a lead to check, and the platform says so rather than concluding for you.
Each entry links straight to the incident it sits near.
Diagnostic coverage
Which data sources would improve the next investigation, and which are not delivering. Only the sources that reduce confidence are expanded, so a fully connected platform shows a short list.
Where to go next
Every section has a link out of it: the queue to Incidents, exceptions to Infrastructure, changes to Deployments and Changes, coverage to Connectors.