Set up a connector
Every tool is connected from the Connections page in the dashboard. Any member can open the page and read what is connected; adding, editing, verifying or removing a connection is reserved to a workspace owner or admin. There is no configuration file to edit and nothing to redeploy. The shortest connection takes three steps, the longest takes five, and the wizard tells you exactly what to create in the other tool before it asks you for anything.
Start from the catalog
Open Connections, choose Add connection, then press Add followed by the provider name on its card, for example Add Grafana. Once you have one connection of that provider the card reads Add another Grafana instead. Search by name or capability, or filter by category; each card shows how many connections you have configured already.
Read Before you start at the top of the wizard, then expand Step-by-step setup instructions for the provider-side steps, the credentials to copy, and the checks that prove the connection works. The progress indicator shows your current step and the total number of steps.
Every wizard has the same shape
flowchart LR
    Where["Where it is<br/>address and scope"] --> Access["What access<br/>it needs"]
    Access --> Cred["The credential<br/>you paste in"]
    Cred --> Review["Review<br/>settings only, no secrets"]
    Review --> Verify["Verify<br/>prove the reads work"]
    Verify --> On["Switched on"]
The progress bar across the top of the wizard names the steps for that particular tool, so you can see how far you have to go before you start.
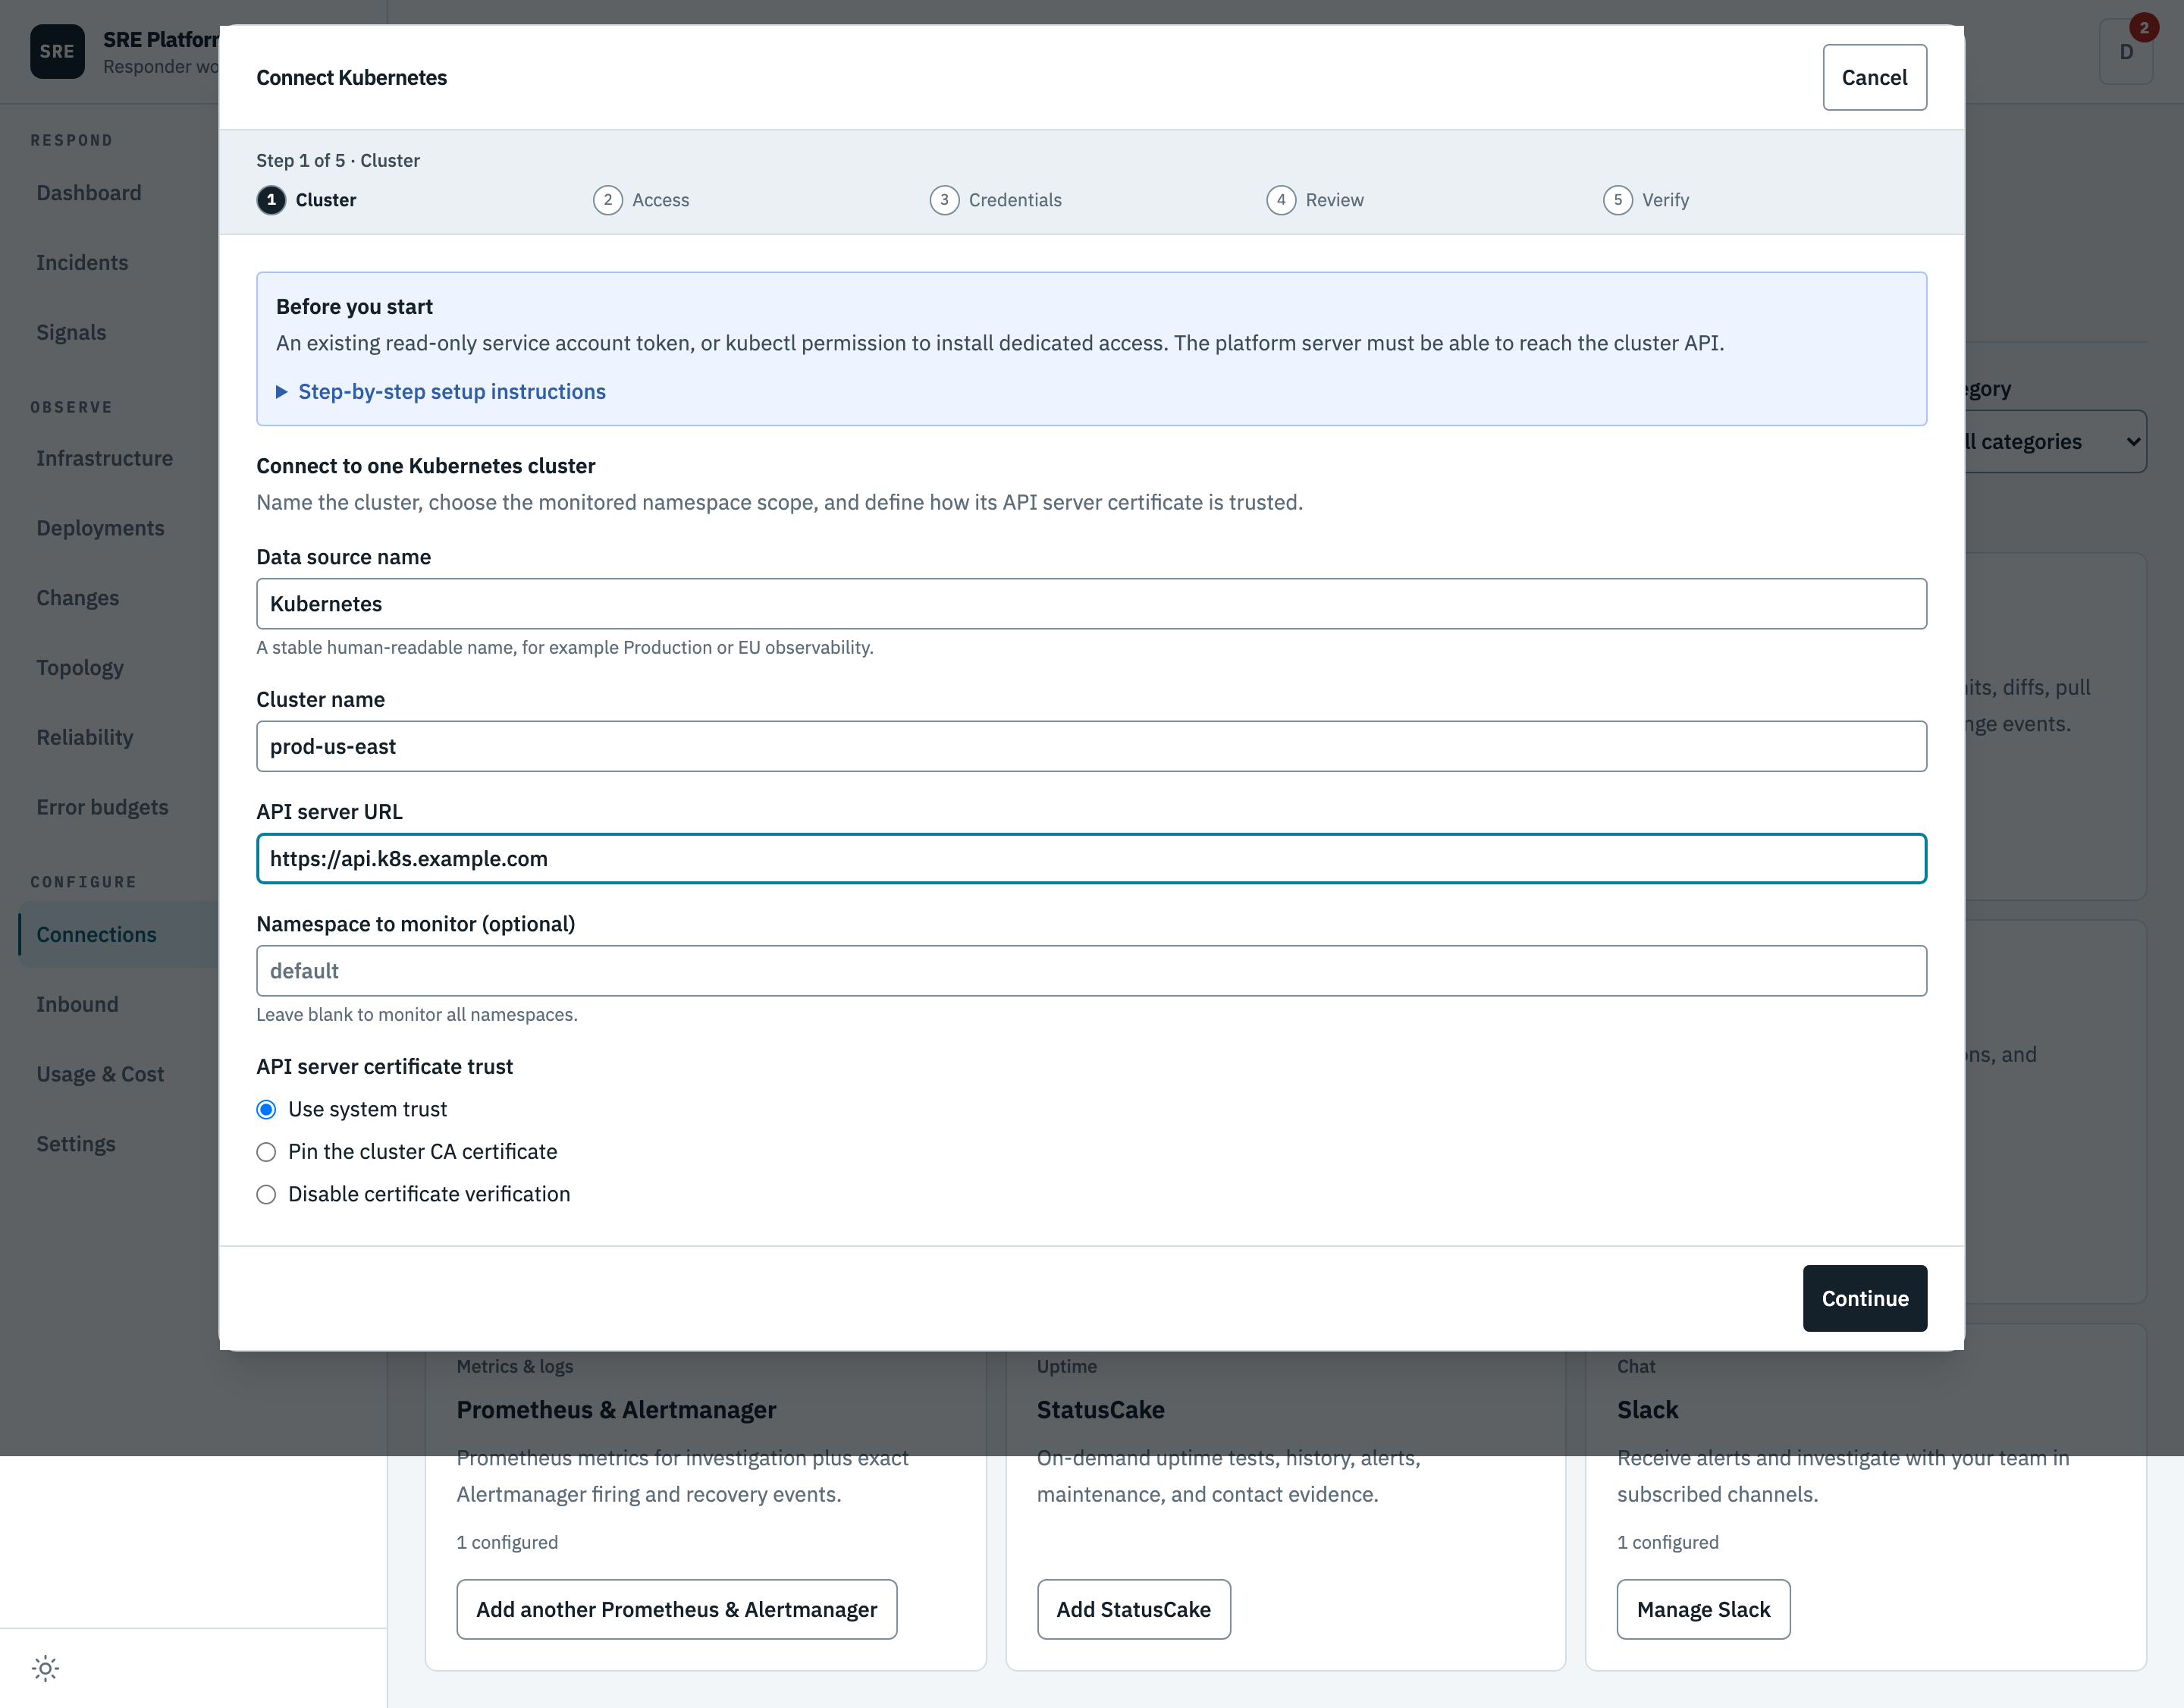
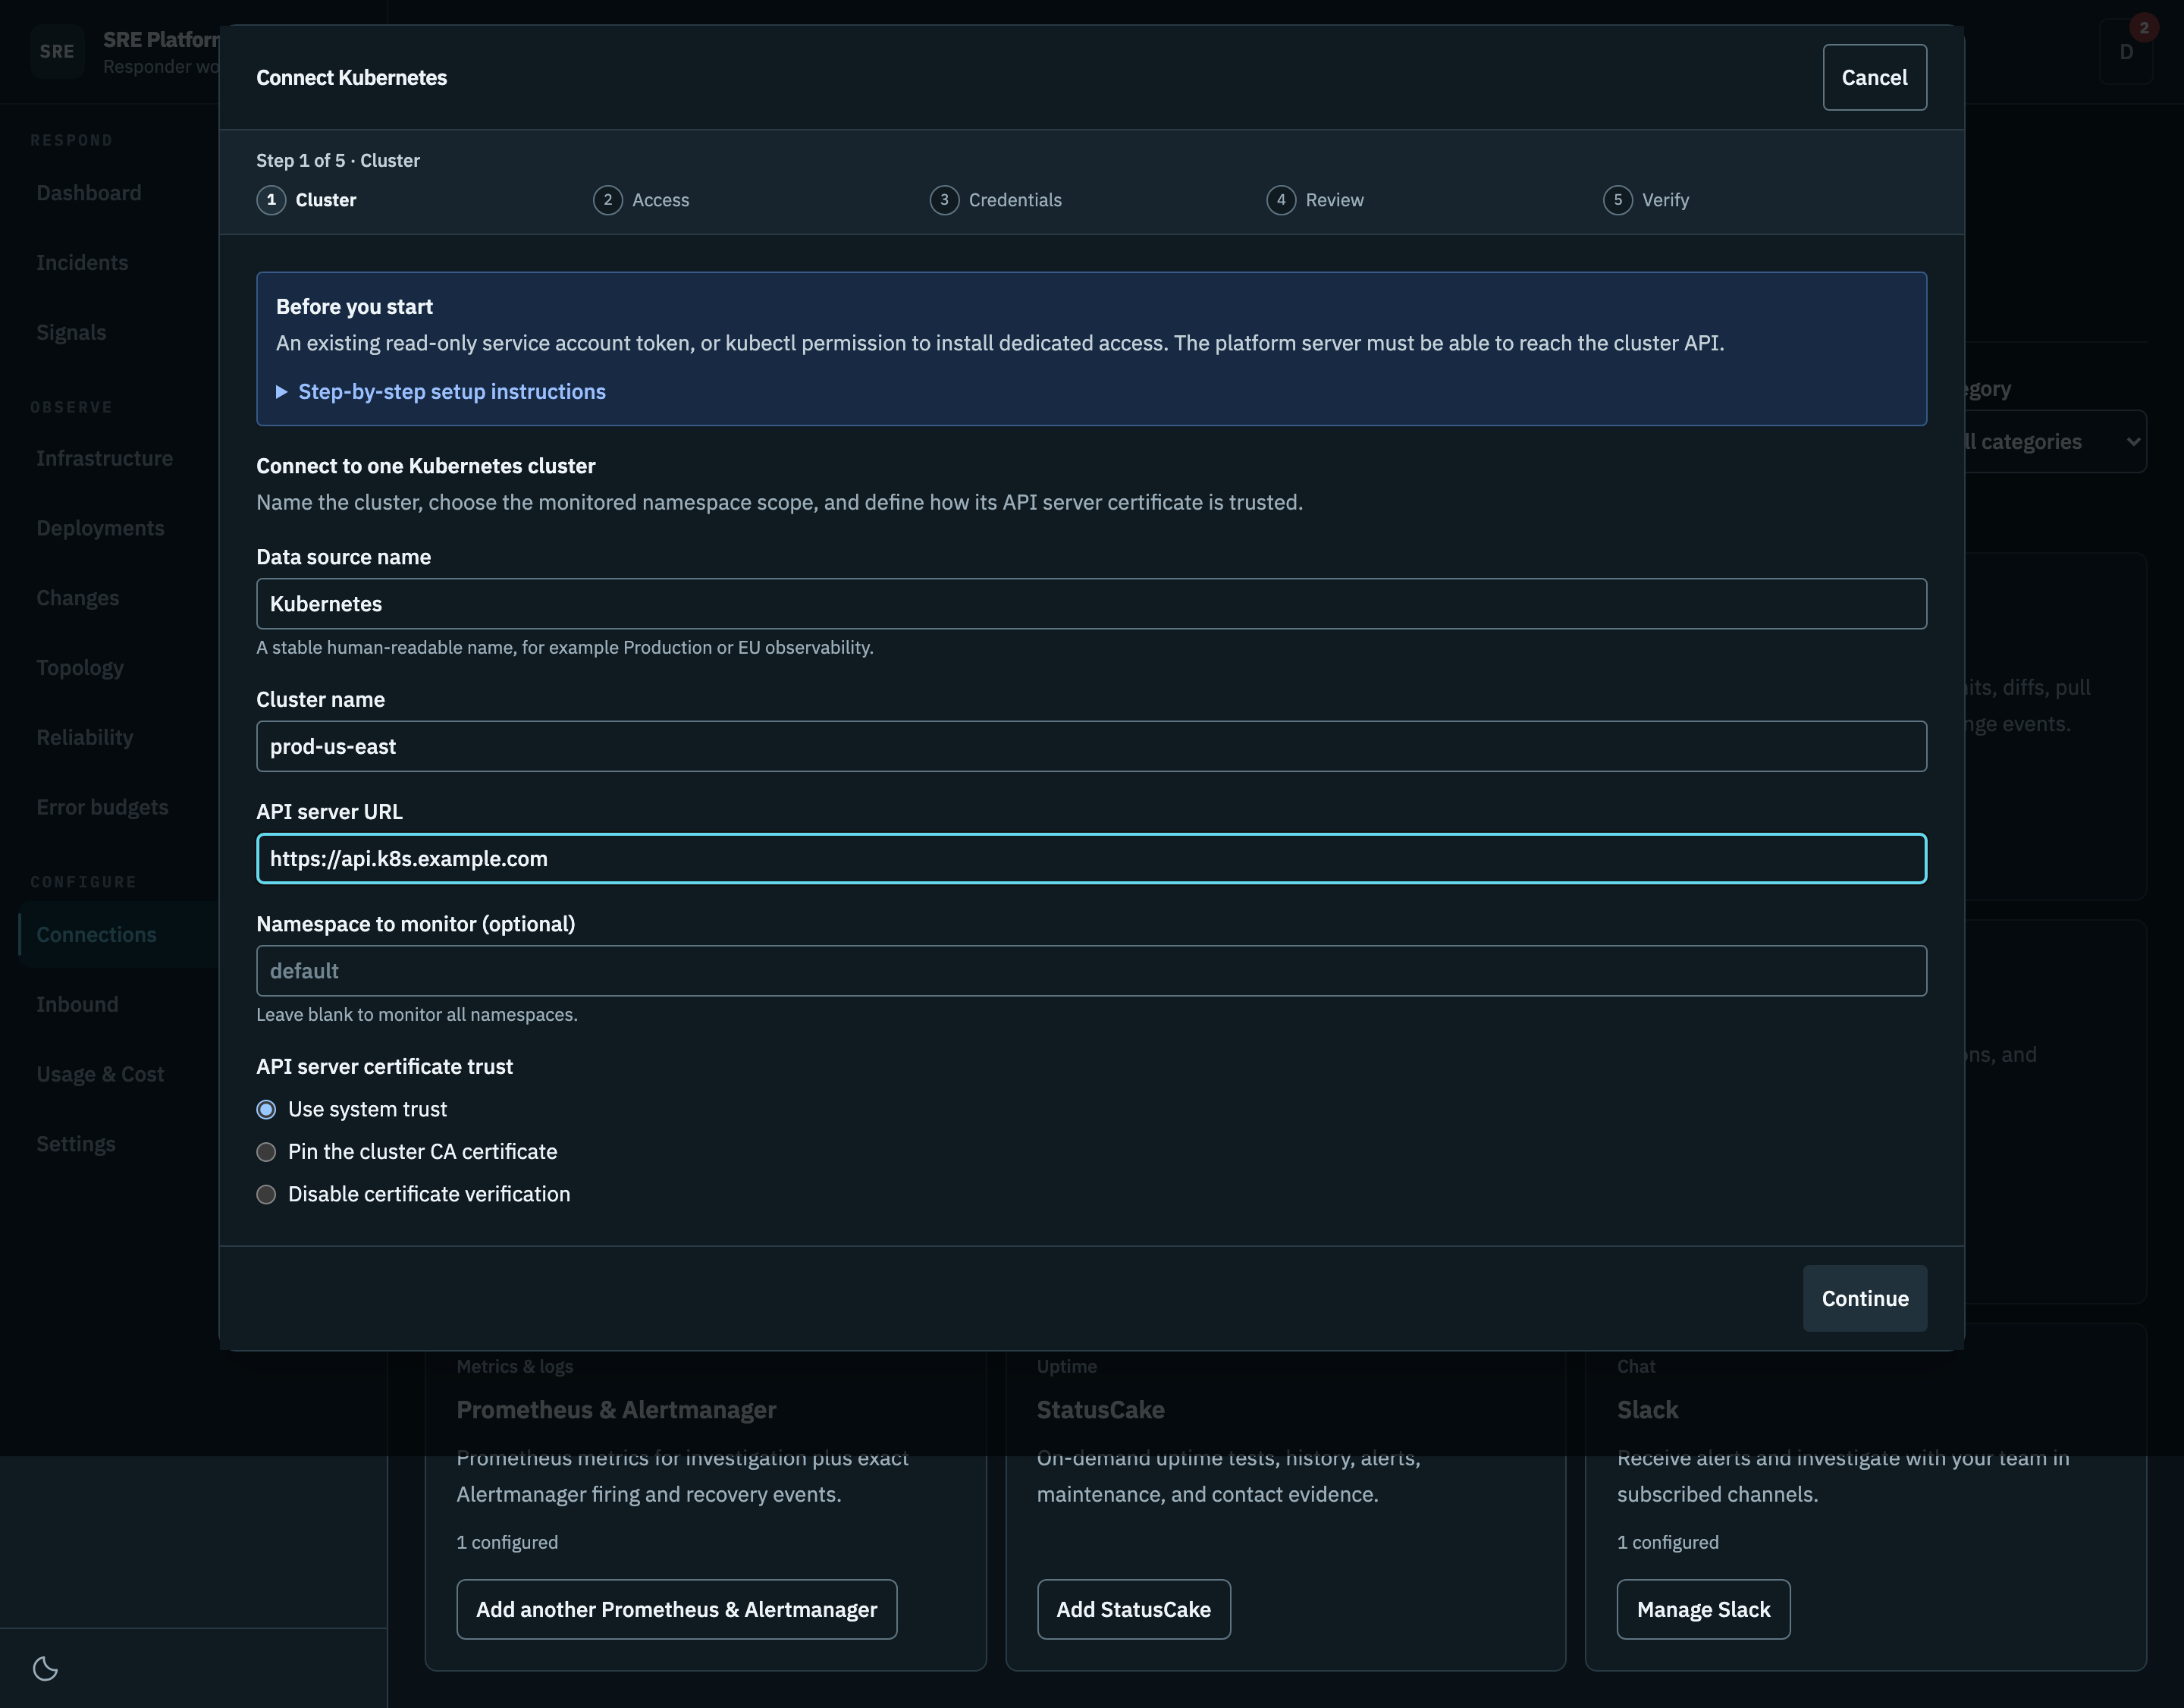
The middle steps differ because the tools differ. What does not differ is that the last two steps are always Review and Verify.
What Review and Verify actually do
Review shows the settings you are about to save and nothing else. Credentials never appear here, because they are never readable once submitted.
Save and verify writes the settings, stores the credential encrypted, and then performs the exact reads the platform will later depend on, against your real system. The connection is switched on only if those reads succeed. If a permission is missing it tells you which one, at setup time, rather than failing silently inside an incident three weeks later.
The success message names what was read, for example Read access verified for GitLab or Prometheus metrics verified for Prometheus. It does not prove incoming events are working. Confirm the first authenticated delivery on the connection details.
That relationship holds afterwards too. Verification runs again when you press Retest, and a check that fails switches the connection back off rather than leaving it to return partial evidence.
Every step is pictured
Each connector page walks its wizard one step at a time, with a screenshot of each screen and what that screen is asking you for. The one exception is the final Verify step of each wizard, which runs against your real system, so it is described rather than pictured.
What you need before you open a wizard
Each connector page lists its prerequisites in a Before you start table, so you can gather the token or the address first and finish the setup in one sitting. The pattern is almost always the same: an address the platform can reach, and a read-only credential you create in the other tool. Kubernetes generates a permissions manifest for you to apply, and GitHub is installed as an App rather than authenticated with a token.
| Provider | Steps | Prepare | Guide |
|---|---|---|---|
| StatusCake | 3 | An API bearer token for your monitoring account | StatusCake |
| Datadog | 4 | The correct site, an API key and a scoped application key | Datadog |
| Grafana | 4 | A Viewer service account token for the required organization and resources | Grafana |
| Kubernetes | 5 | Cluster access to install the generated read-only RBAC and service account | Kubernetes |
| Prometheus and Alertmanager | 5 | The endpoint's read credential; optional Alertmanager receiver administration | Prometheus and Alertmanager |
| GitLab | 5 | Group-scoped Reporter access with read_api; separate hook-management permission for events |
GitLab |
| GitHub | 5 | A dedicated App, installation access, private key and webhook secret, or use the generated App flow | GitHub App setup |
| Argo CD | 5 | Project-role administration and a token for each selected project | Argo CD |
| Slack | Own guide | An App with Socket Mode, bot events, an app token and a bot token | Connect Slack |
Network probe is not in this table because it is not in the catalog. It is built in, has no data source and no credential, and is available to every investigation from the start.
Reuse access you already have
You do not need to recreate an account or credential for every setup. Existing access must match the provider, endpoint, organization, and permissions this connection needs. The platform does not copy a secret from another connection or workspace.
| Provider | What can be reused |
|---|---|
| Kubernetes | Existing read-only service account and RBAC. Choose Use existing access; installed connections can keep their stored token and CA. |
| Argo CD | A dedicated project role with one token per selected project. Enter its role name; it must not already belong to another data source. The legacy sre-platform role remains reserved for existing connections. |
| GitHub | An existing dedicated read-only App and installation, not an App whose webhook serves another integration. |
| GitLab | A valid group-scoped Reporter token with read_api. Hook setup is separate. |
| Datadog | The API key and scoped application key pair. Leave both blank when editing to keep them; provide both when replacing them. |
| Grafana | A read-only service account token for the target organization. |
| Prometheus | The endpoint's existing authentication, including no authentication when appropriate. Alertmanager delivery remains separate. |
| StatusCake | A valid API token for the target account. |
| Slack | An existing App and its matching app/bot tokens, dedicated to this connection rather than shared with another active Socket Mode consumer. |
New credentials are needed when existing access is missing, expired, revoked, or does not have the required permissions. Keep separate credentials where independent revocation or isolation is needed.
Which address belongs in which field?
| Field | Enter | Do not enter |
|---|---|---|
| GitHub or GitLab webhook URL | The complete generated URL, including the connector-specific path | Just the API origin or an invented connector ID |
| Smee channel URL | The full Webhook Proxy URL from a new Smee channel | A production API address |
| Kubernetes API URL | The target cluster's HTTPS API server address | A Kubernetes dashboard address or your kubeconfig file |
| Argo CD URL | The Argo CD HTTPS server address | An individual application page |
| Prometheus base URL | The Prometheus HTTP API base address | Alertmanager, a graph page, or a query endpoint path |
| Grafana base URL | The Grafana instance address | A dashboard link or Cloud metrics ingestion address |
| GitLab URL and group path | Instance URL and group path in separate fields | A whole project URL |
| Datadog site | The site hosting your Datadog organization | The region of the servers you monitor |
The platform server makes provider API requests. An endpoint that works in your browser may still be unreachable from that server. Check routing, DNS, firewall rules, and certificate trust from the platform's network. Do not disable certificate verification to solve a connectivity problem.
The platform's own API URL is deployment configuration, not a connector field. Public webhook addresses are generated from that configuration for GitHub, GitLab, and Alertmanager. If no suitable HTTPS address is configured, ask the platform administrator to correct it. Local development can use a Smee relay instead. External provider URLs remain editable because they identify the system you want to connect.
Finish both sides of event delivery
GitHub, GitLab, and optional Alertmanager delivery require provider-side configuration as well as saving in SRE Platform. Existing public GitHub and GitLab webhook URLs are available on opening Manage. Alertmanager shows its URL in the delivery step, together with receiver setup guidance. Use the Copy button; if the browser denies clipboard access, select and copy the displayed text.
For a new connection, the delivery step prepares the full URL before you save. Public delivery allocates a connector-specific path; Smee creates a development channel automatically. Copy that exact URL into the provider, finish saving in SRE Platform, then send or redeliver a test event. Preparing a URL does not activate a receiver. Back/Next and save retries retain the address; closing an unsaved setup discards it. Existing saved addresses remain unchanged. If preparation fails, use Retry webhook preparation. GitLab's signed-hook command and Alertmanager's receiver configuration include additional required settings; copying only the URL does not replace those steps.
For a failed delivery, inspect the provider's delivery response and check the URL, TLS certificate, network access, and matching secret.
Datadog, Grafana, Kubernetes, Argo CD, and StatusCake do not need incoming webhooks for these connectors. Slack uses Socket Mode, so it does not need a public callback URL either. Valid Slack tokens alone do not prove messages will arrive: subscribe to events, invite the bot, and select the channels the platform should listen to.
Adding a second one of the same tool
Choose Add connection, then Add another on the provider card. A provider that supports only one connection shows Already configured instead. Each connection has its own credential, its own scope, and its own status; the difference between a connector and a data source is explained in Connect your tools.
Give them names you will recognise under pressure. The name is what appears beside the evidence in an incident.
Manage existing connections
The main page lists your saved connections, not every available provider. Search by connection name, provider, or scope. Use Needs attention to find access checks or data delivery that need review. A verified access check does not prove events or polling are working: the Access and Data activity columns report them separately. No recent events alone does not prove a failure.
Open a connection to see detailed evidence, change its configuration with Manage, or Retest access. Connection detail addresses can be bookmarked and shared with workspace members. More actions contains Disconnect, which asks for confirmation. Back to connections returns to your filtered inventory. What every status badge means is on the Connections page reference.
The polling snapshot count is the total returned by the last successful poll, not just deployment records. For Kubernetes it includes pod and node snapshots. A successful empty poll reports zero; a failed poll retains the previous successful count alongside the failure status.
Slack is available in the same catalog and inventory. Its detail view manages chat access and channel subscriptions. Inbound focuses on channel subscriptions and message processing activity, with a link back to connection settings. Each evidence provider retains its own setup guide and verification checks.
Editing and rotating credentials
Credentials are write-only. You can replace one, but the platform never shows it back to you, not even partially, and stored credentials are not loaded into edit forms. Where a field says to leave it blank to keep the credential, blank means unchanged, not removed. Do not copy secrets into a ticket, screenshot, or source repository. Coordinate webhook-secret rotation with the provider so both sides agree.
Disconnecting the platform does not revoke provider-side tokens, Apps, hooks, or RBAC. Follow the provider guide to remove that access when it is no longer needed.
Adding a tool that does not exist yet
Everything above is configuration. If the tool you need is not in the catalog at all, or a connector you use is missing a read you want, that is a code change rather than a setup step. See Add a connector.