Incidents
Every case, filtered the way you want it. The dashboard shows you the top of this list; this page is the whole of it.
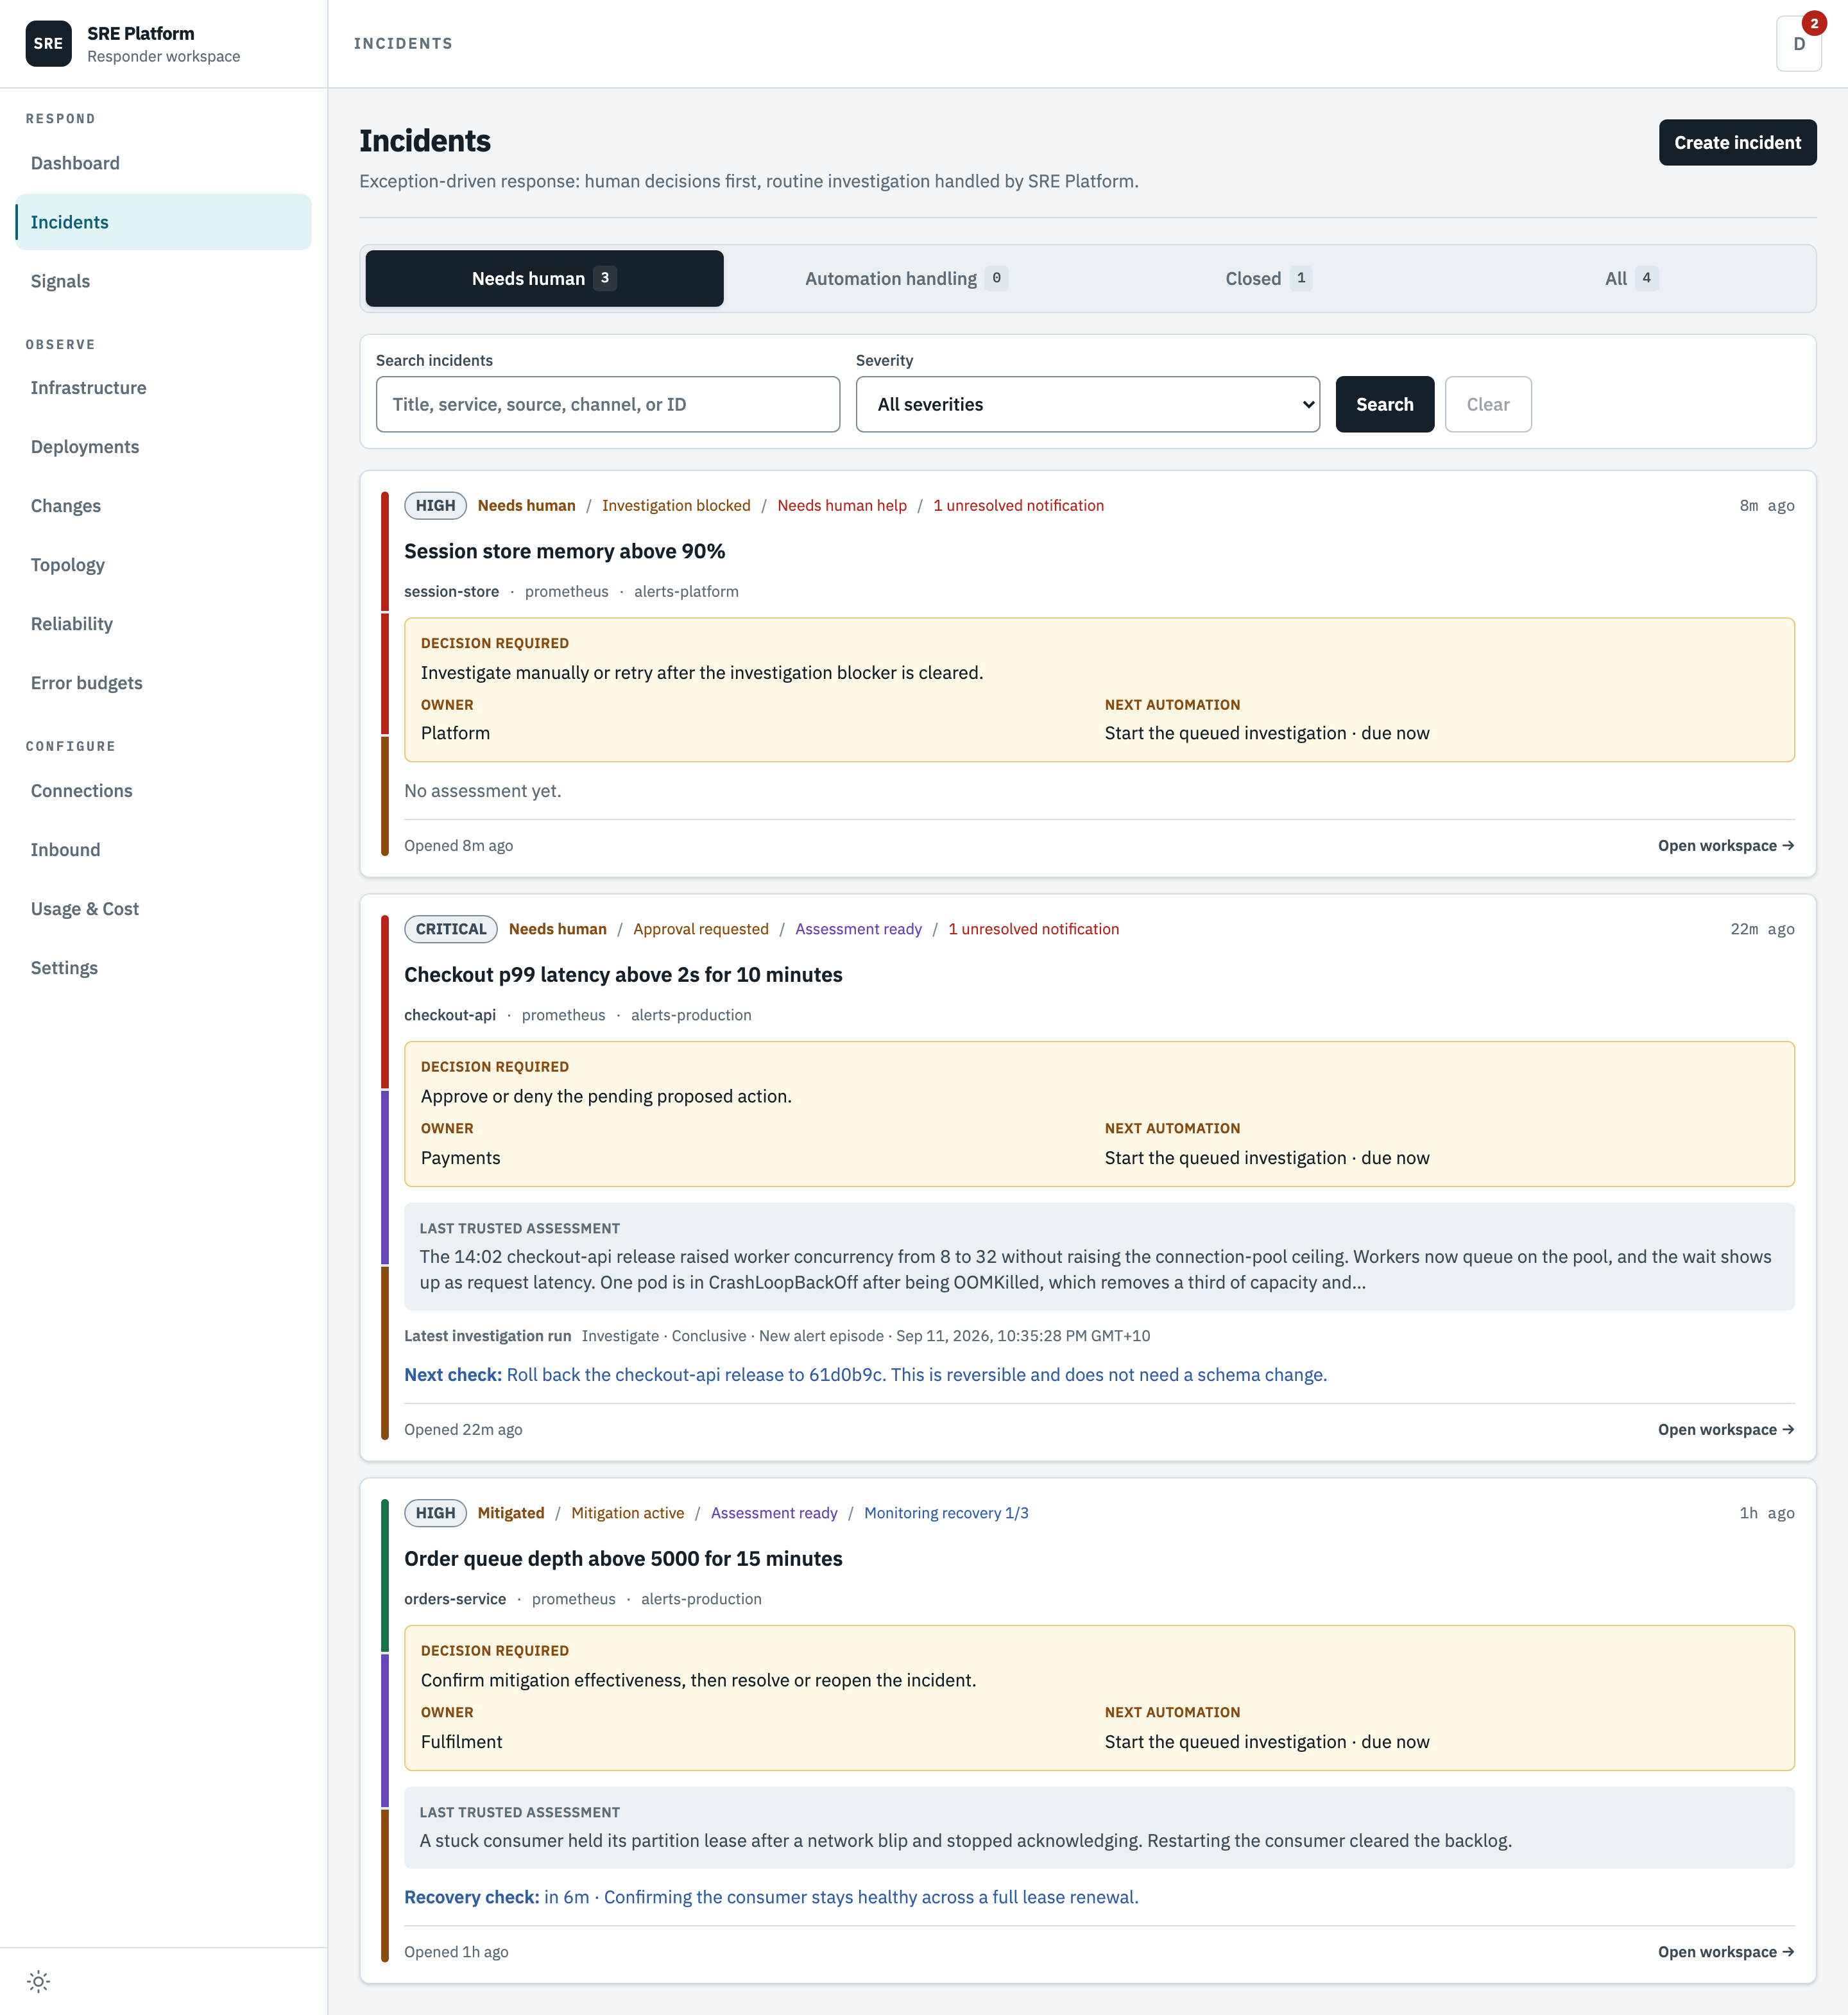
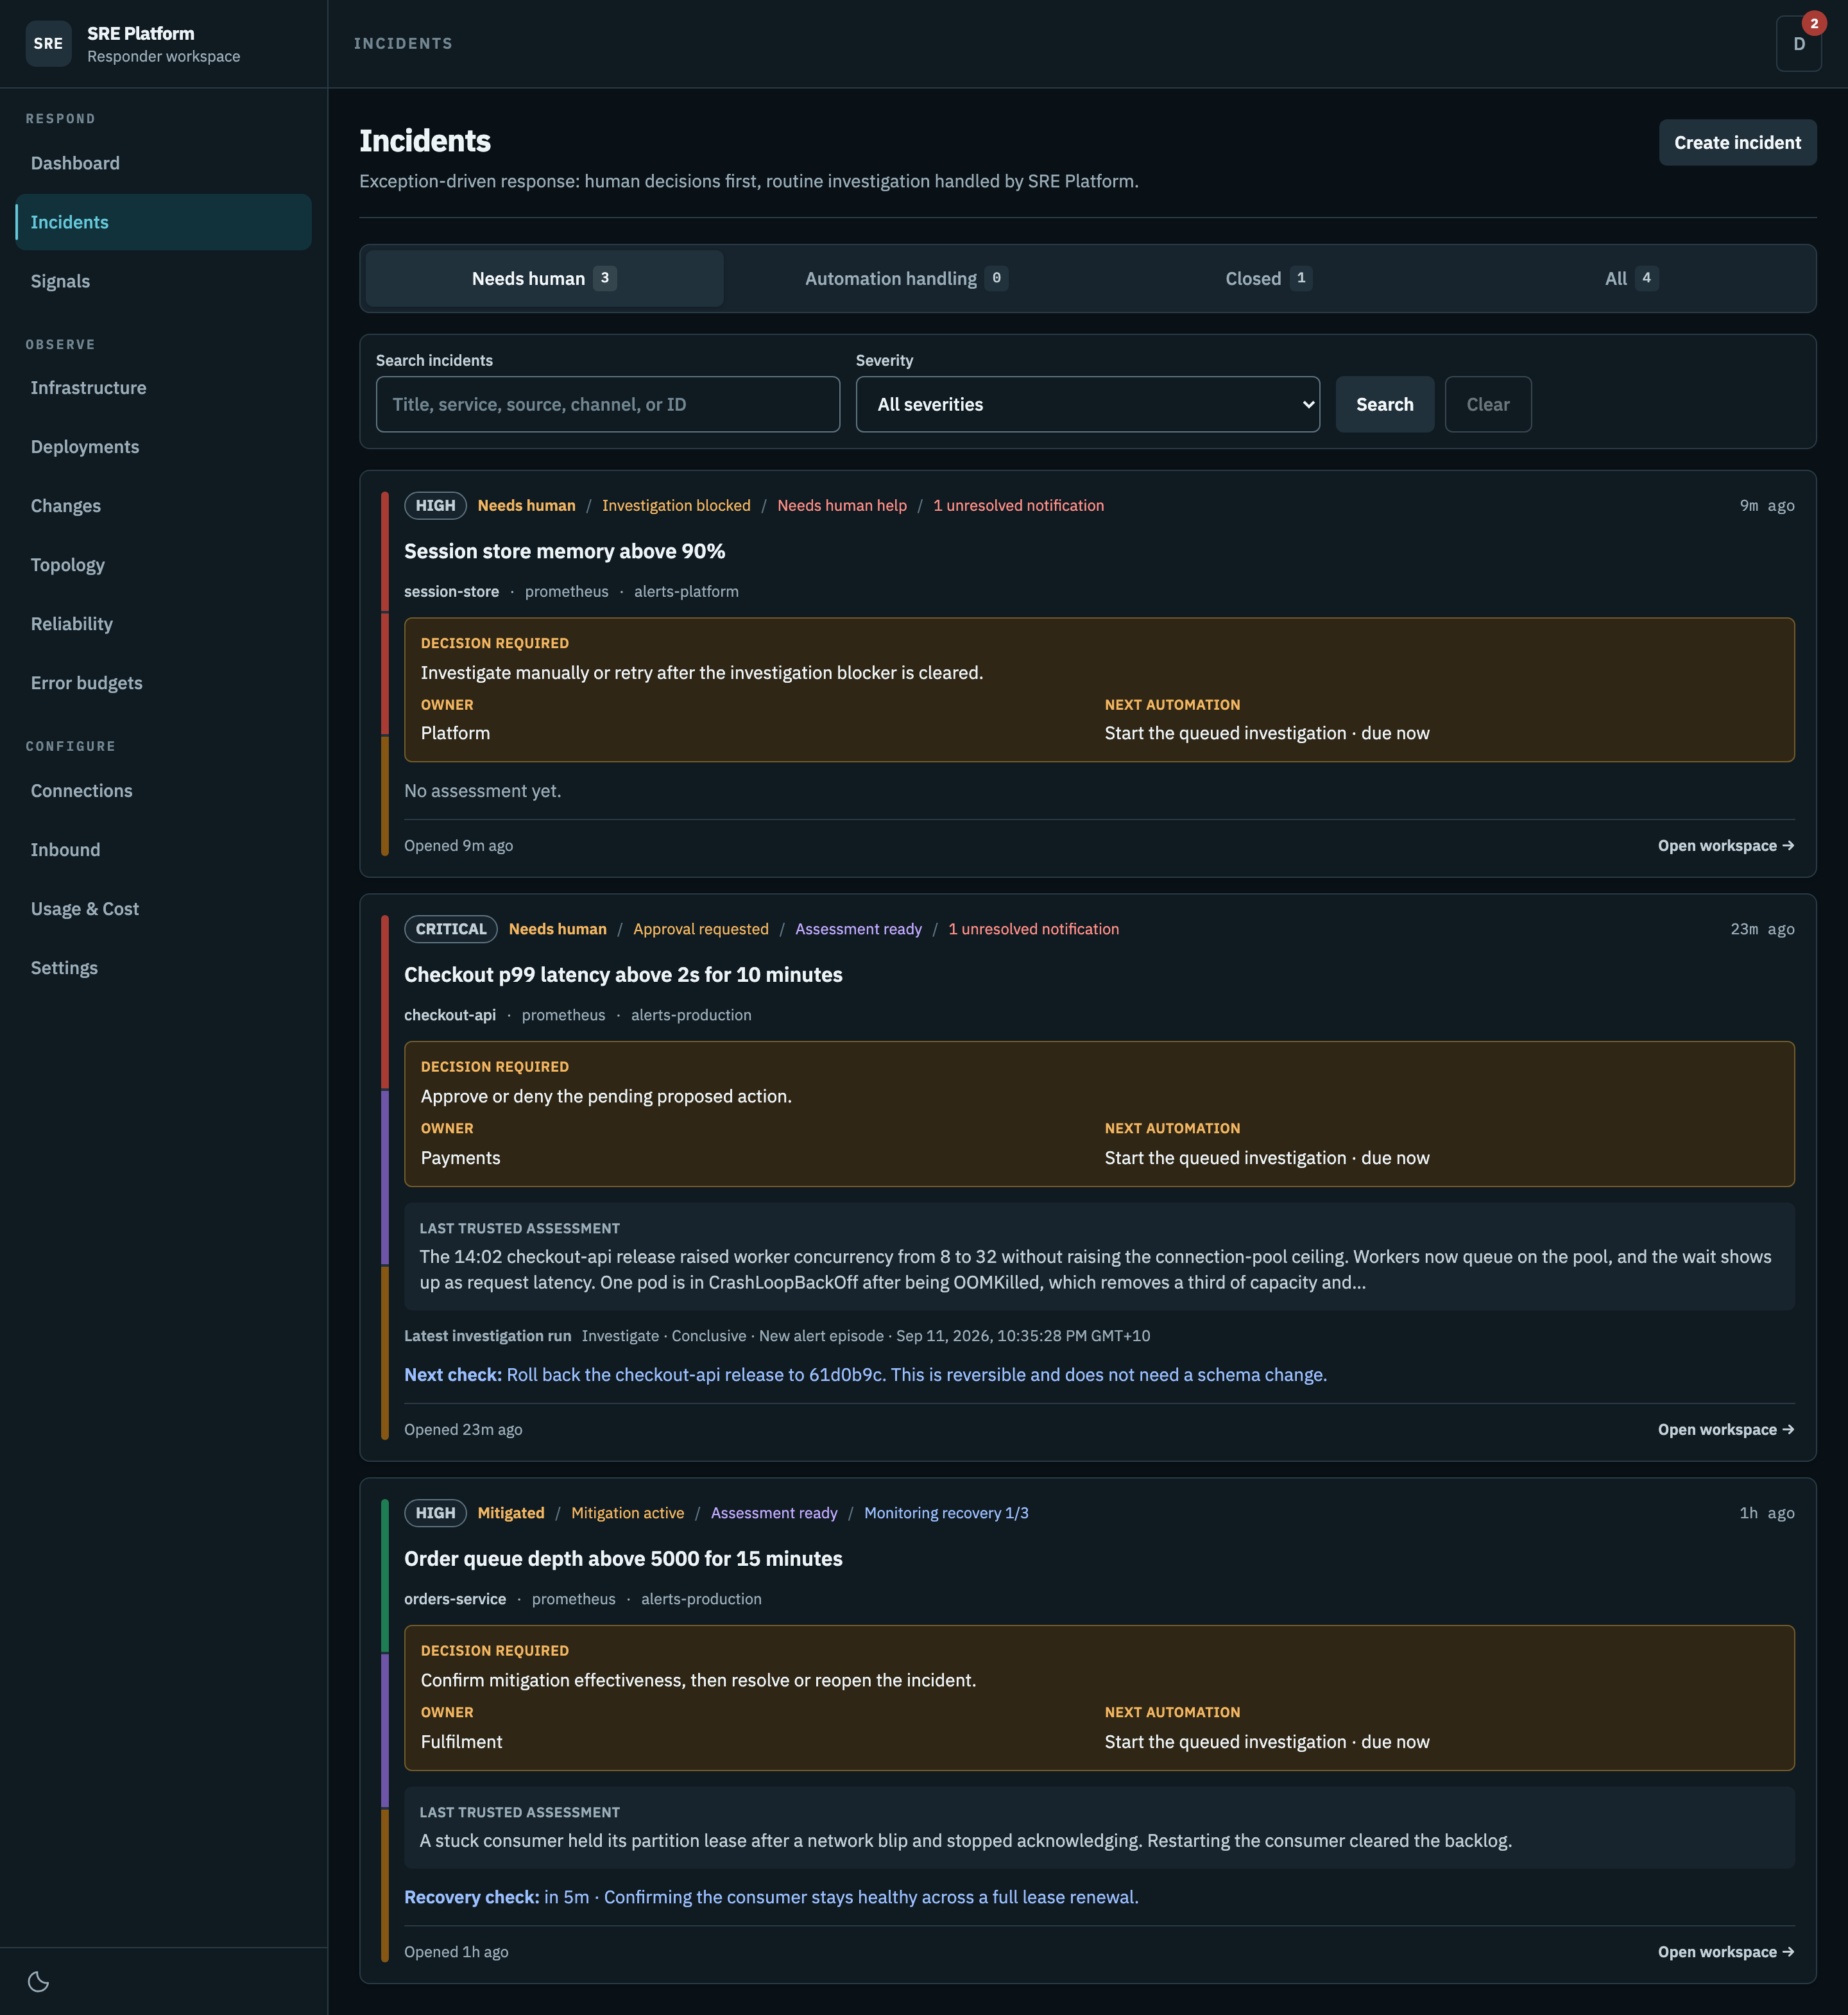
The four tabs
| Tab | Contains |
|---|---|
| Needs human | Something is waiting on a person: an approval, a blocked investigation, an unverified recovery |
| Automation handling | The engine is working on it and has not asked for anything |
| Closed | Resolved and closed cases |
| All | Everything, in one list |
Each tab carries its own count. The split exists so that "nothing needs me" is a state you can see at a glance rather than infer.
Search and severity
Search matches the title, the service, the source, the channel, or the incident identifier. The severity filter narrows to one level. Both are applied by the server, so filtering a long history does not depend on how much of it your browser has loaded.
Reading one card
Every card is the same shape.
| Part | What it tells you |
|---|---|
| Severity pill | How bad, as the alert declared it |
| State chips | The lane it is in, why it is there, and whether an alert is still unresolved |
| Title | The alert's own words, not a generated summary |
| Downstream symptom of | Present only when evidence names another incident as this one's direct cause |
| Service, source, channel | Which service, which monitoring tool raised it, which Slack channel it arrived in |
| Decision required | Present only when a person is blocking. Names the decision, the responsible team, and what the platform will do next without you |
| Assessment | The current conclusion, or "No assessment yet" |
| Age and workspace link | When it opened, and the way in |
The Decision required box is the important one. It never says "look at this"; it names the specific decision, so you can tell whether it is yours to make before you open anything.
Incidents that share a cause
When evidence establishes that one incident caused another, the queue stops presenting them as unrelated work. The direct cause is listed first and its symptoms follow it, indented under it, with the indentation stopping after three levels so a deep chain stays readable. Each symptom names its direct cause under its own title.
The nesting is presentation. Every incident in the group keeps its own card, its own investigation, and its own Slack thread, and opening any of them shows the whole graph and the way back to the root.
Creating an incident yourself
Create incident opens a case from evidence the platform already holds, for something monitoring never alerted on. An incident created this way has no Slack thread, because no conversation started it. It lives on the dashboard only.
What the states mean
flowchart LR
    Open["open<br/>live case"] --> Mitigated["mitigated<br/>impact stopped"]
    Mitigated --> Resolved["resolved<br/>recovery verified"]
    Open --> Resolved
    Resolved --> Closed["closed<br/>follow-up finished"]
    Resolved --> Reopened["reopened"]
    Reopened --> Open
Status is changed by people and by a fixed policy, never by the model on its own, and never by something said in conversation. An alert clearing is evidence the problem stopped. It is not proof, and the platform verifies before it resolves anything.