StatusCake
StatusCake gives the platform an outside-in view: uptime, certificate, page-speed, and heartbeat checks, and how long each has been failing.
That is the one thing your internal telemetry cannot tell you, whether the service is reachable from outside at all.
What it adds to an investigation
Alerts do not arrive through it. They arrive in Slack, like every other signal.
How it is wired
flowchart LR
    Inc["An investigation<br/>needs evidence"] --> Tools["Read-only tools"]
    Tools --> Cake["StatusCake"]
    Cake --> Scrub["Result scrubbed<br/>of secrets"]
    Scrub --> Thread["Evidence in the<br/>incident thread"]
One path. Nothing is polled and nothing is pushed, so between incidents the platform sends StatusCake no traffic. Its value is the outside view: it is the only source that is not measuring your systems from inside your own network.
Before you start
| You need | Why |
|---|---|
| One API token from your StatusCake account | Stored encrypted |
The older API, with a username and an API key, is not supported. The current one does not accept it either.
The platform talks to https://api.statuscake.com and nowhere else, so your token can only ever be
sent to real StatusCake.
Connect it
Open Connections, choose Add connection, then Add StatusCake. Three steps, the shortest setup in the product. The catalog and the shape every wizard shares are in Set up a connector.
1. API token
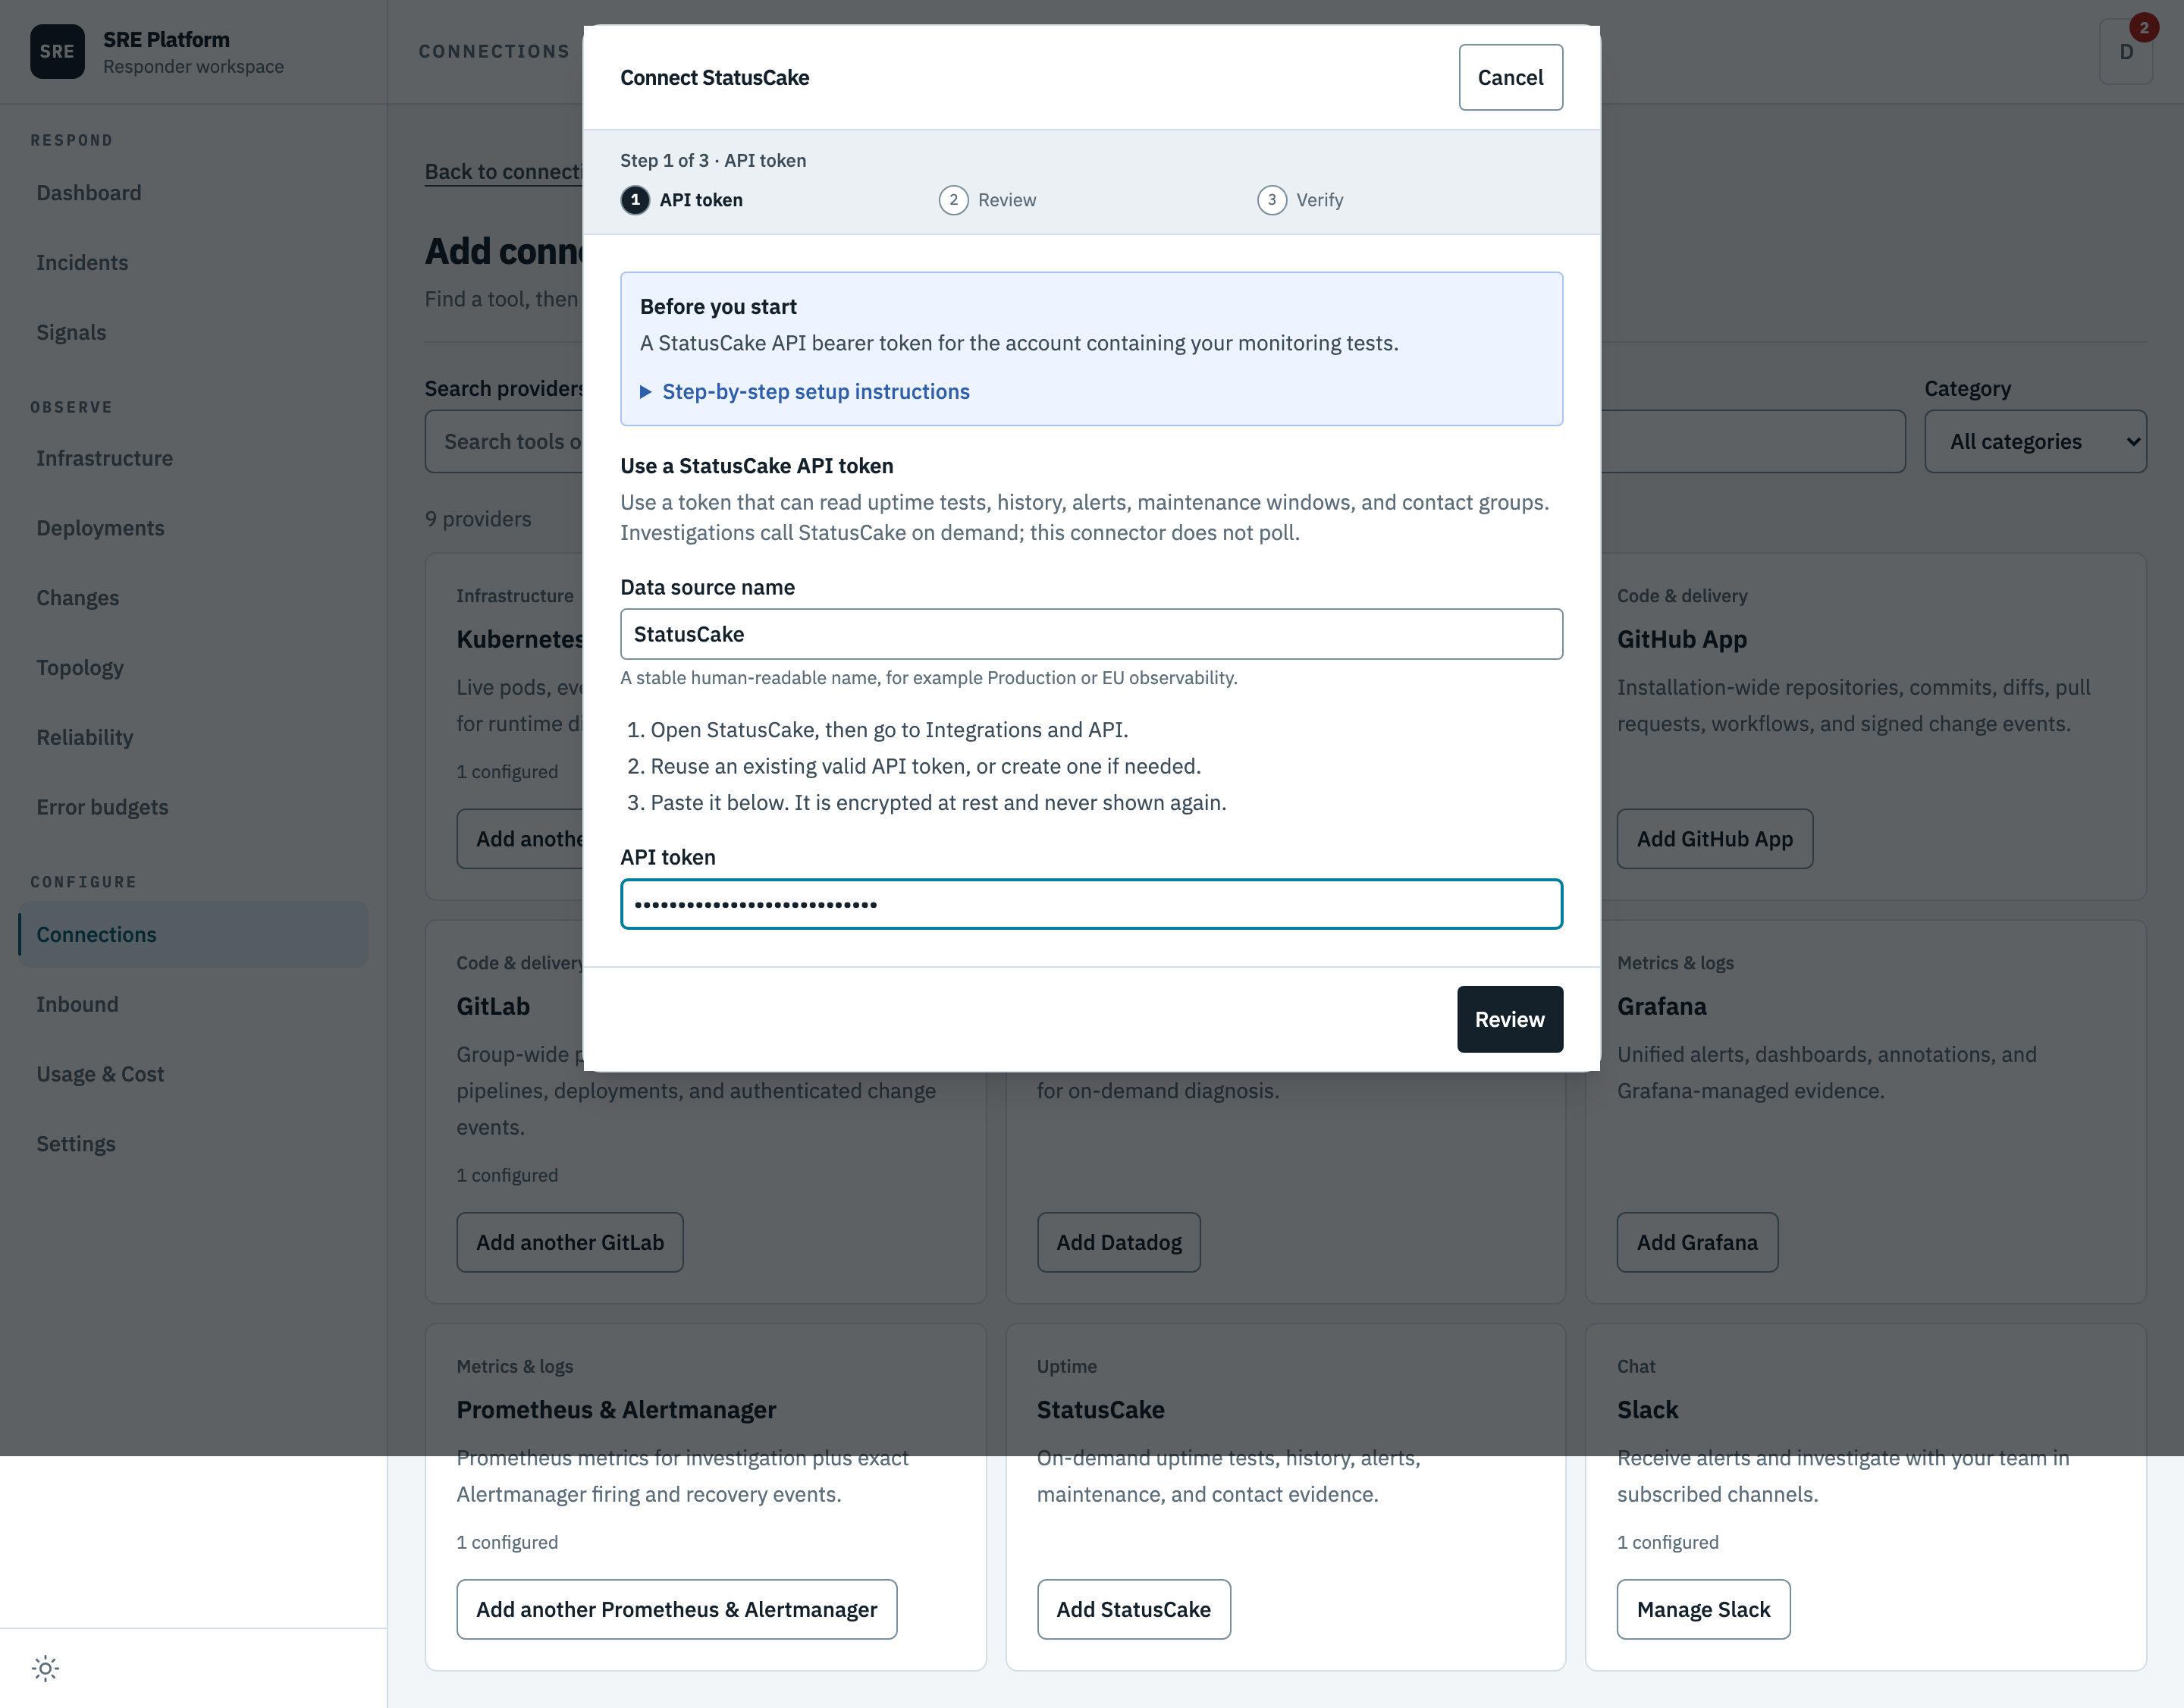
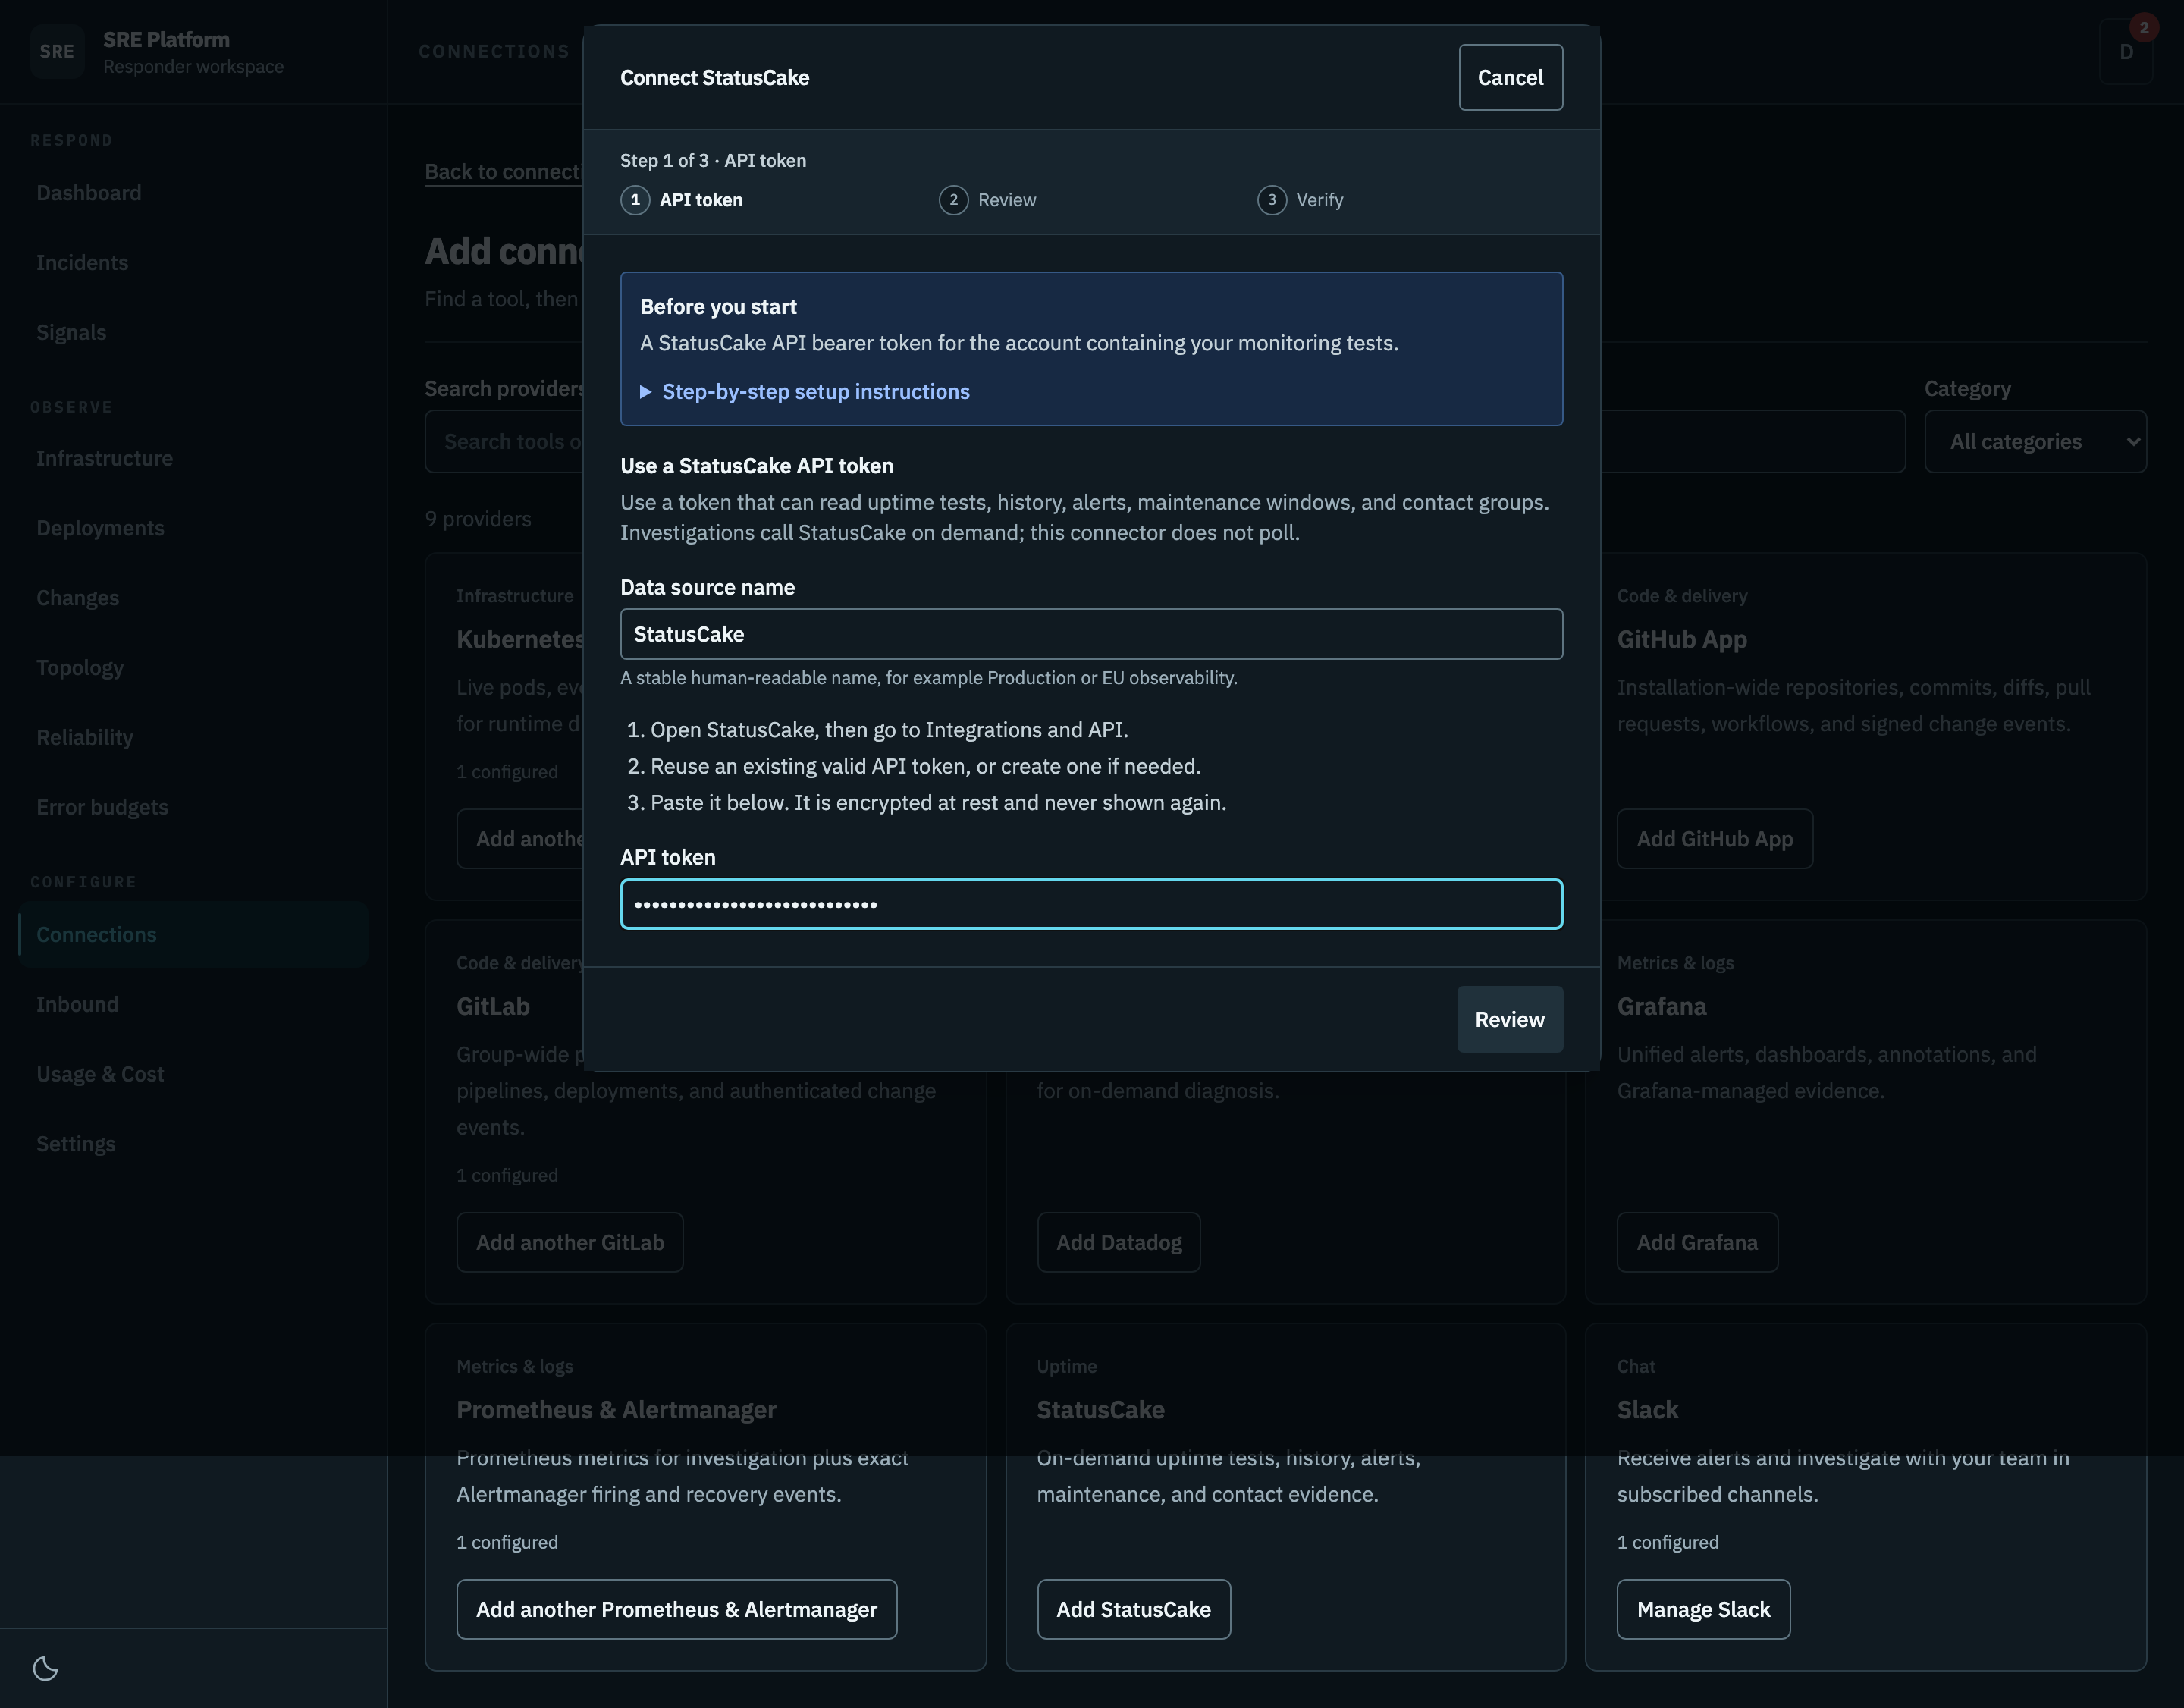
Reuse a valid token, or create one if needed, that can read uptime tests, history, alerts, maintenance windows, and contact groups, then paste it. The wizard lists where to find it in StatusCake.
2. Review
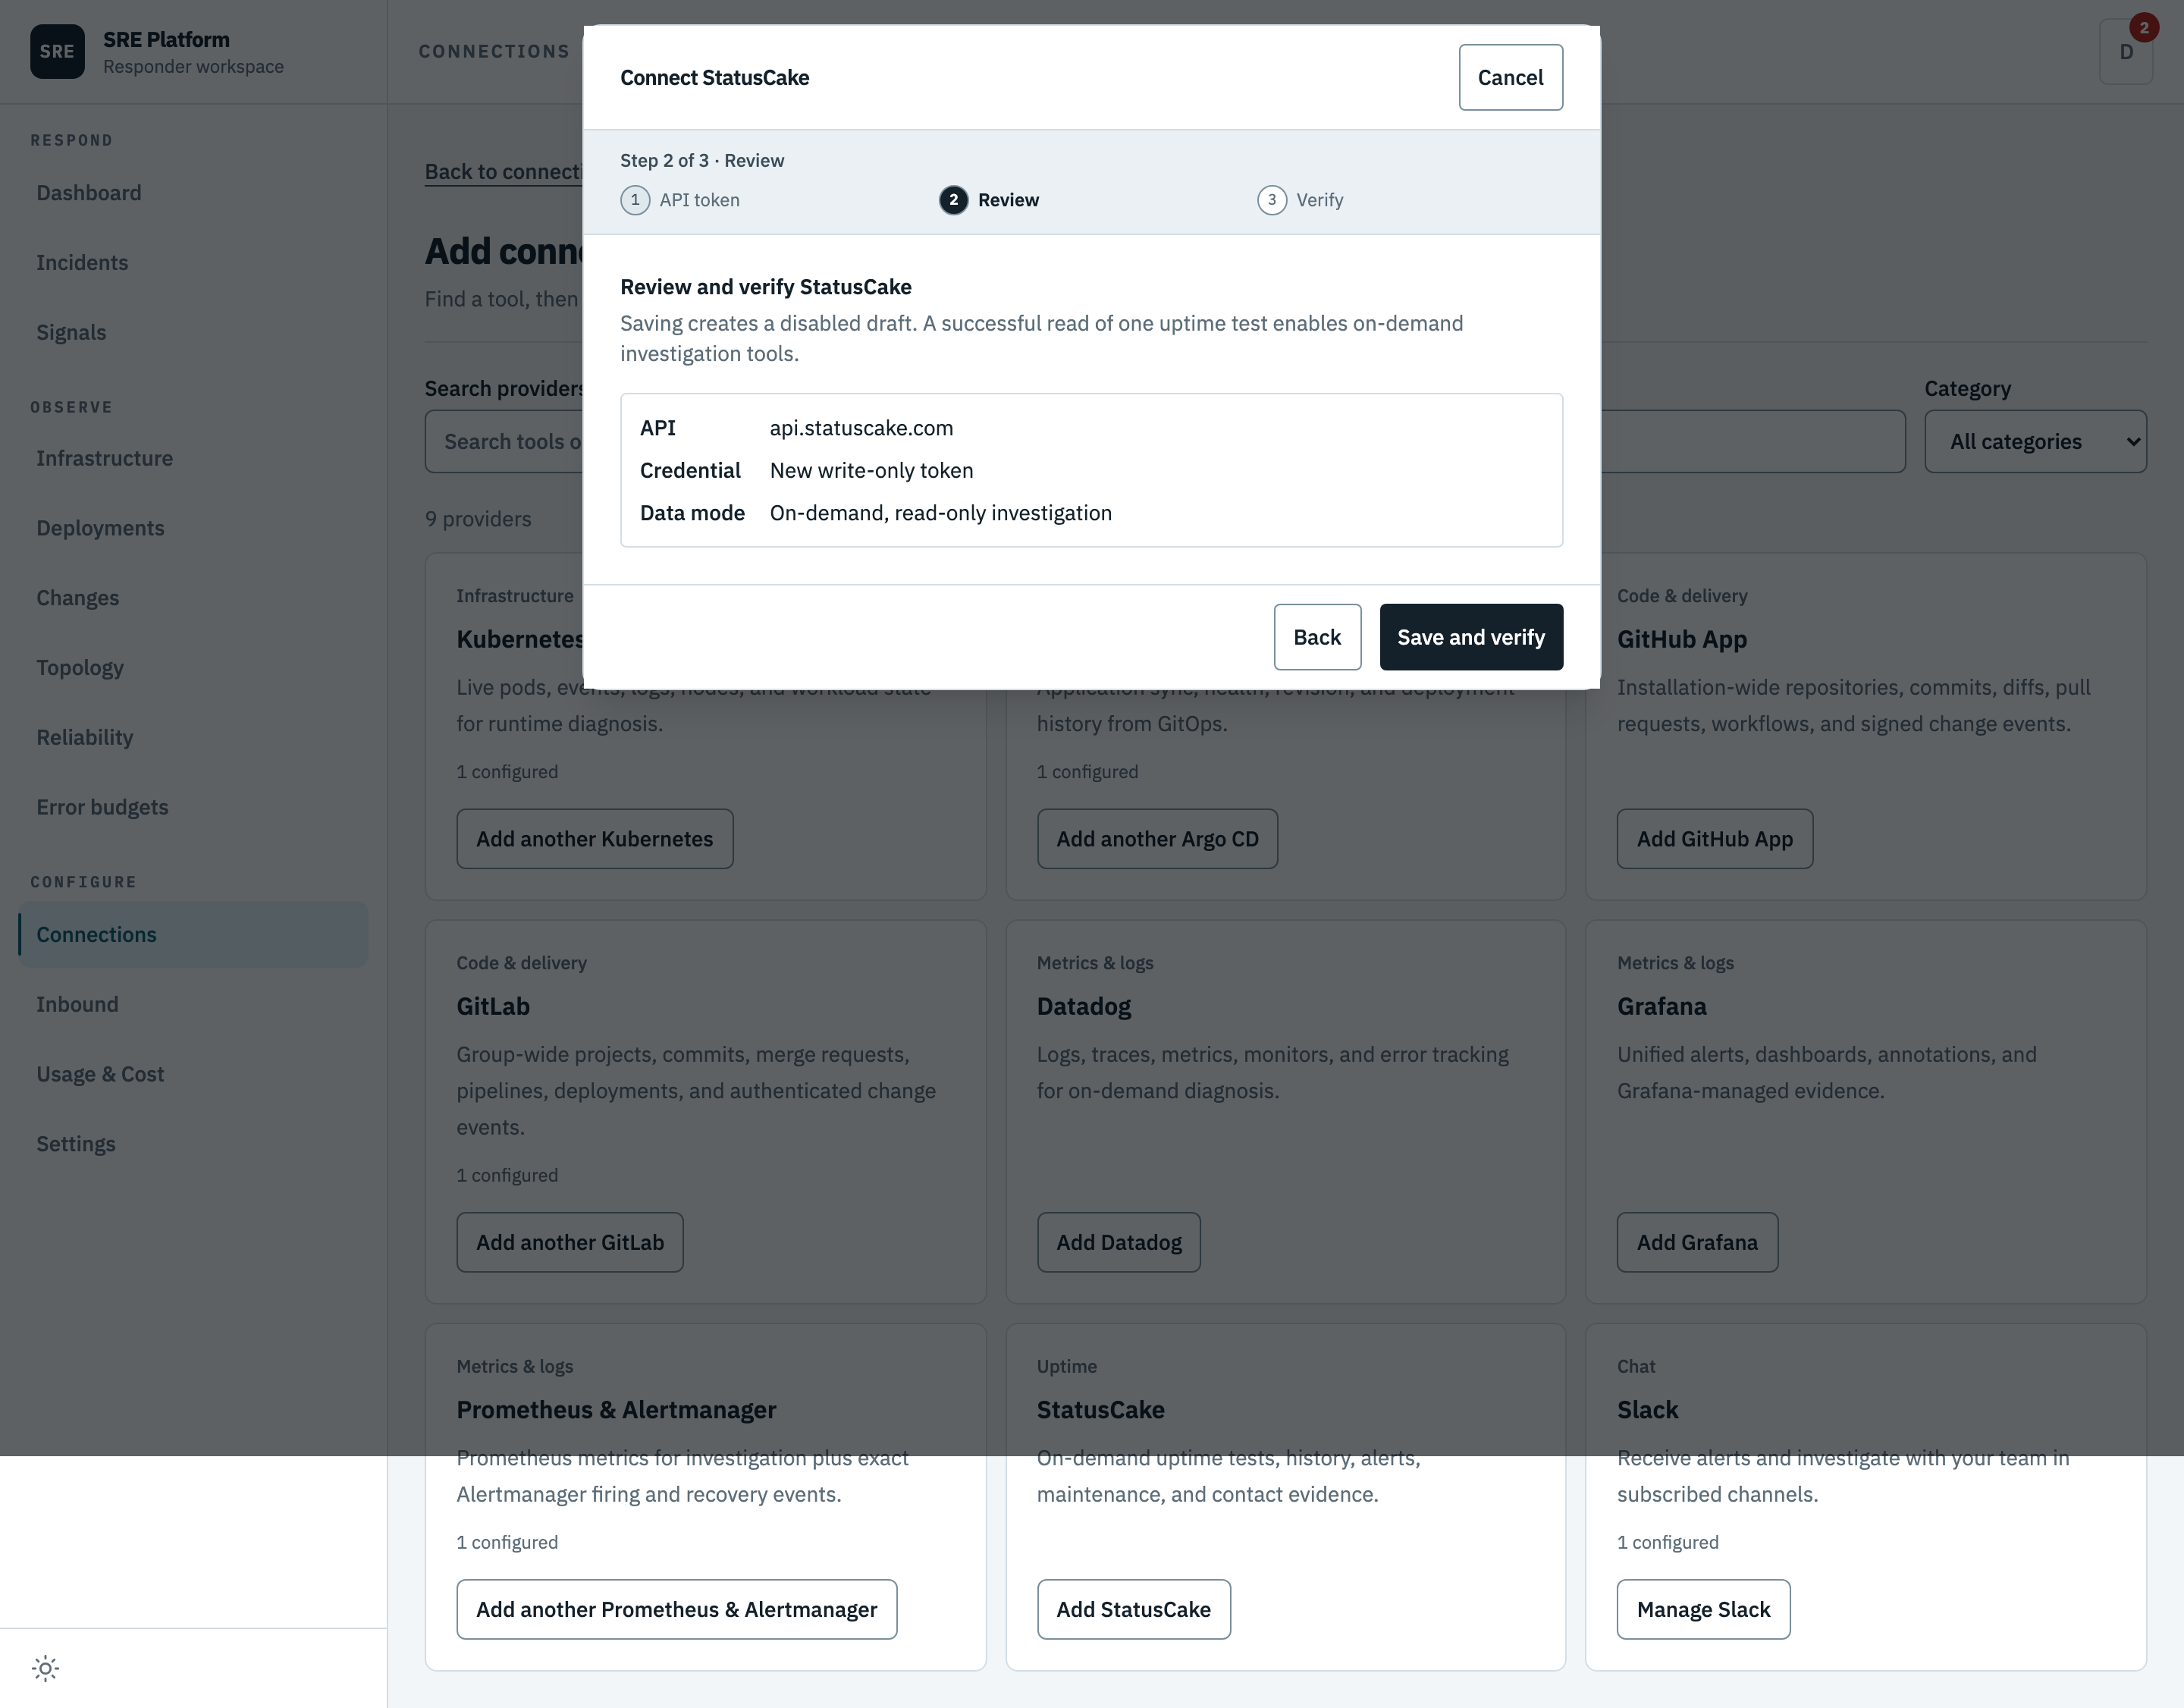
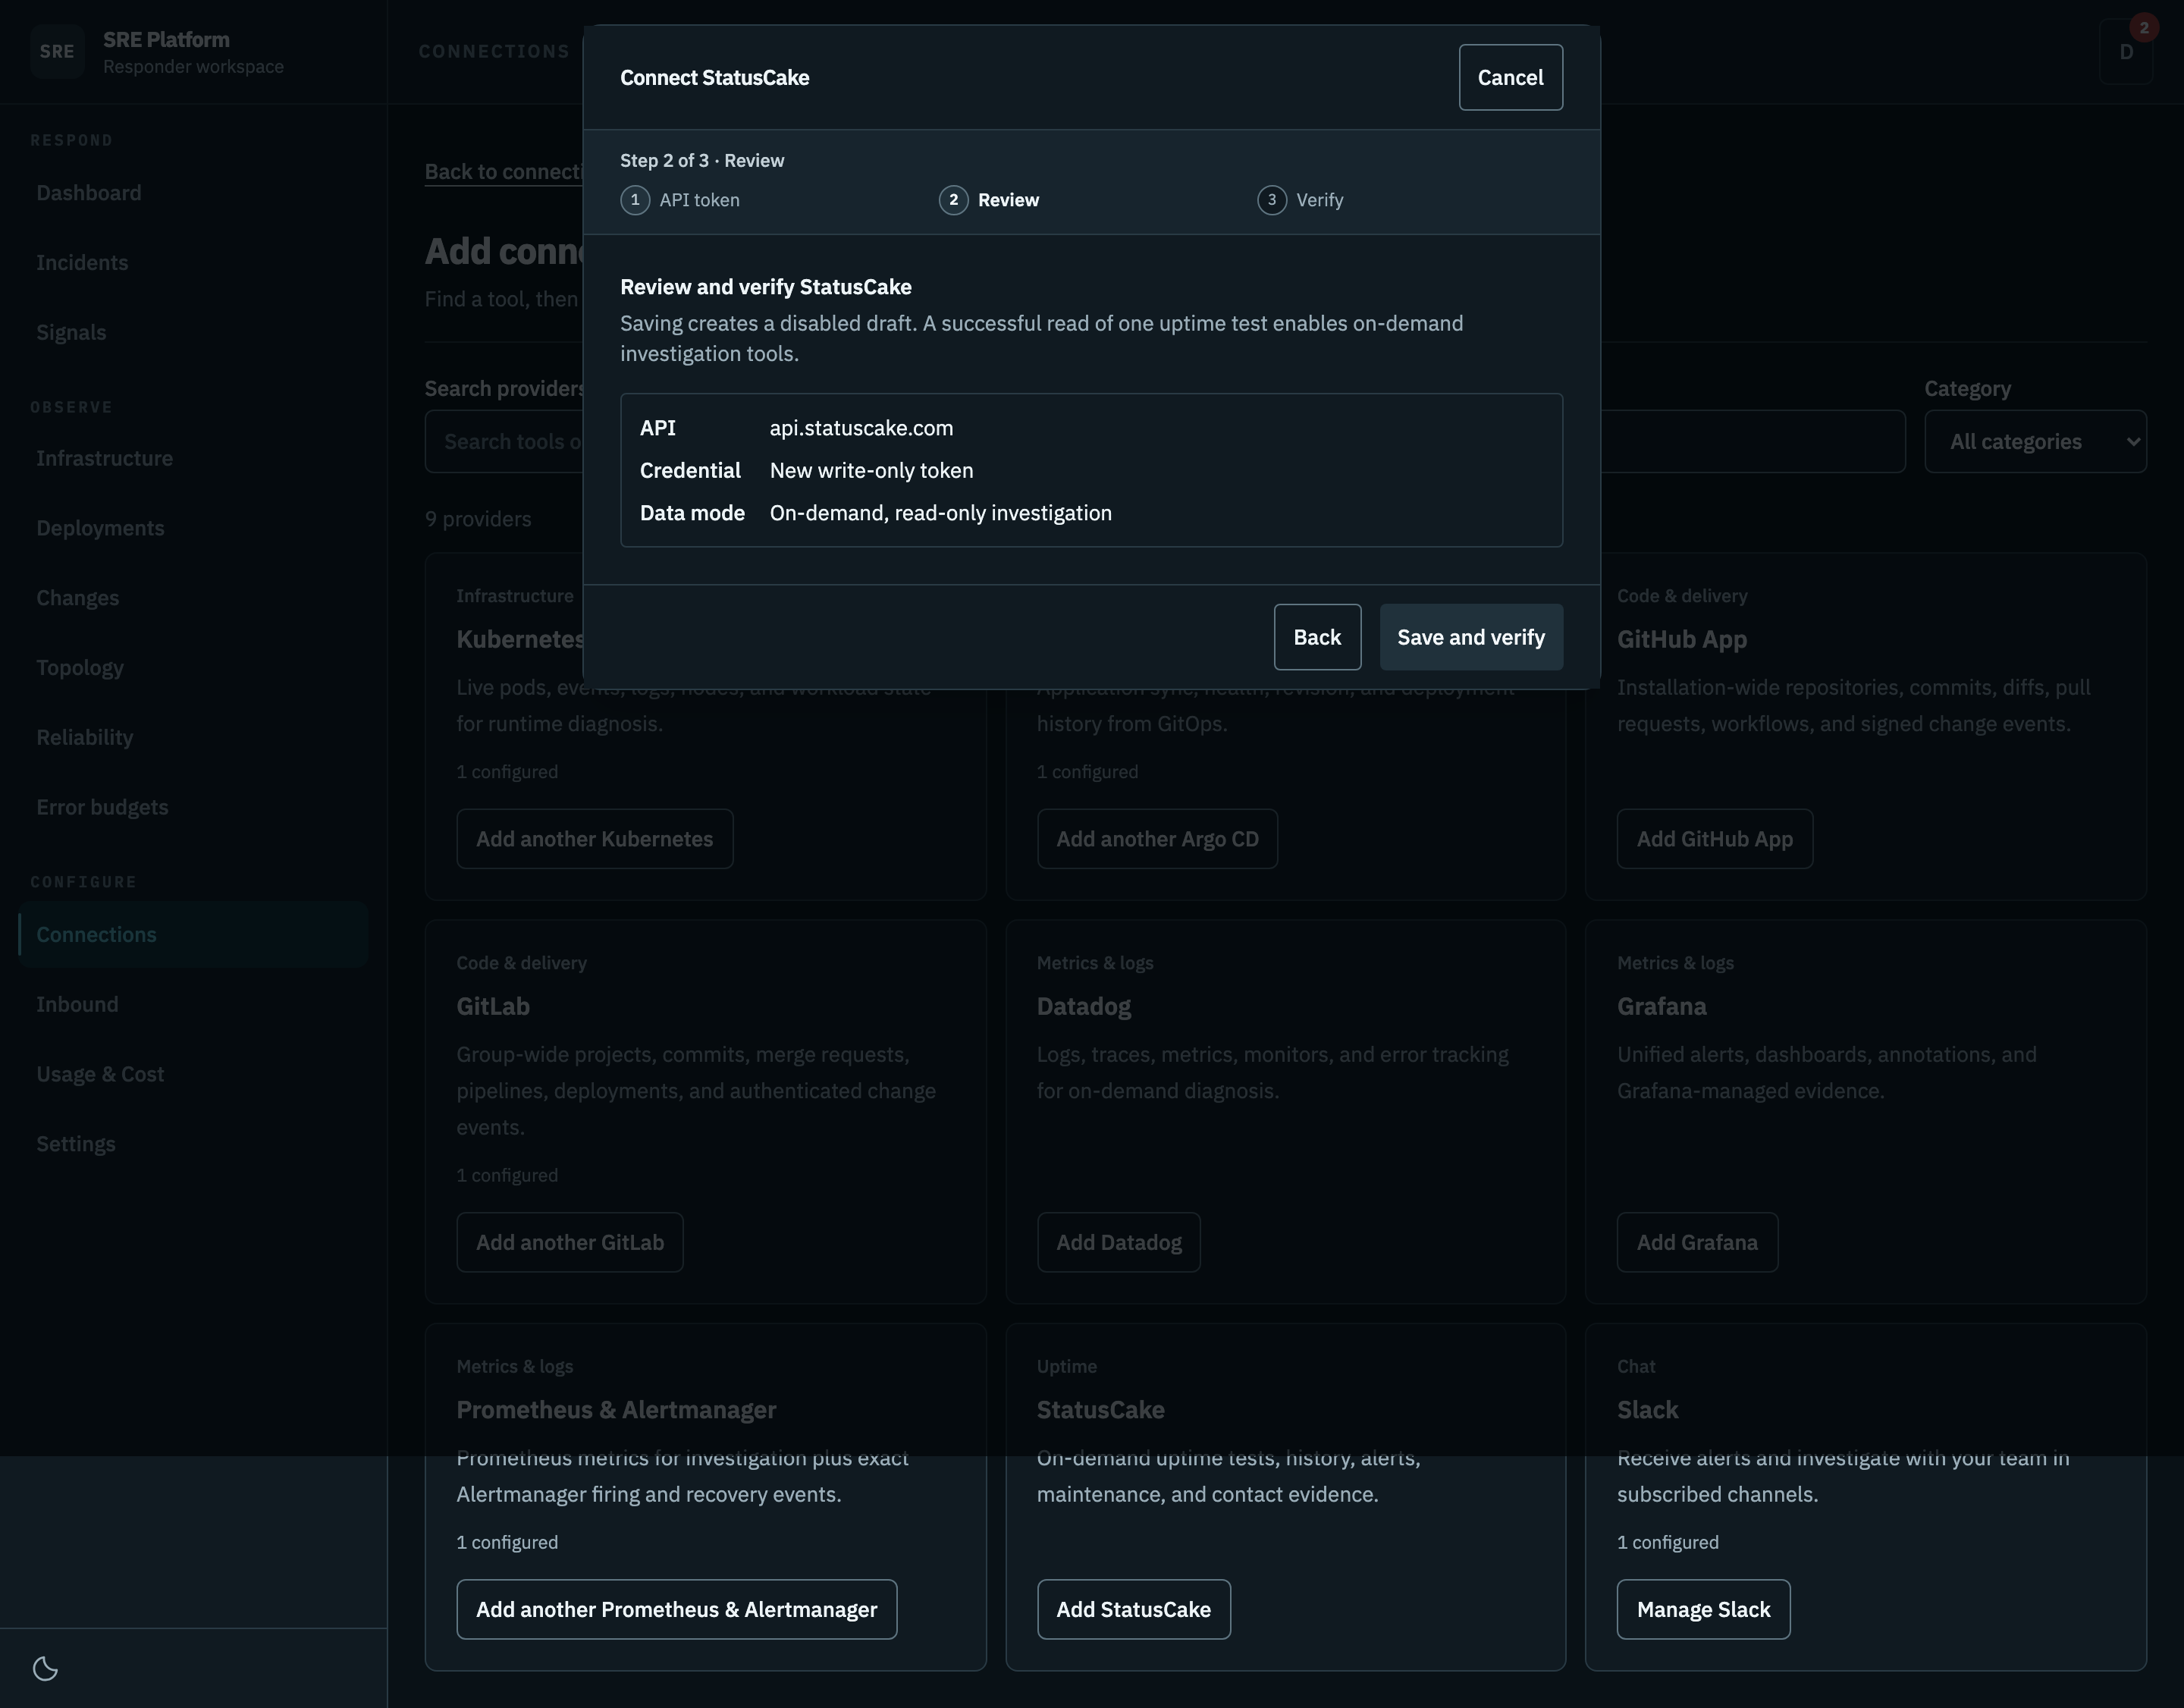
The pinned API host, whether the credential is new or kept, and the access mode. Saving creates a disabled draft.
3. Verify
Makes one trivial listing request. A success switches the connector on. A rejected token is reported as exactly that.
This step runs against your real system, so it is not pictured here.
What it can read
| Tool | What it does |
|---|---|
list_tests |
List checks of a given type with their status (the "what is up/down" inventory). type is one of uptime, ssl, pagespeed, heartbeat. Optional tags (comma-separated) and matchany (true = any tag, false = all tags) to scope to a service. Paginated: optional page/per_page; the response metadata carries page_count/total_count. |
get_test |
Get one check by type and id: full config and current status. type is uptime, ssl, pagespeed, or heartbeat. For ssl this carries the certificate expiry/validity fields (the "down because the cert expired" signal). |
get_test_history |
Get the recent check-run history for a test (the raw pass/fail signal over time). type is uptime or pagespeed (ssl and heartbeat have no history endpoint). Paginated: optional page/per_page. |
get_uptime_periods |
Get the up/down periods for an uptime test — the downtime windows ("since when down"), each with a start, end, and duration. Paginated: optional page/per_page. |
get_uptime_alerts |
Get the alerts StatusCake sent for an uptime test. Paginated: optional page/per_page. |
list_maintenance_windows |
List maintenance windows — scheduled periods where alerts are paused (is this "down" expected?). Paginated: optional page/per_page. |
list_contact_groups |
List contact groups — who gets alerted. Paginated: optional page/per_page. |
api_get |
GET any StatusCake API endpoint by path (e.g. "v1/maintenance-windows/{id}", "v1/contact-groups/{id}", "v1/ssl/{id}"). Read-only. Use for anything the named tools do not cover. |
Every tool is a read. The four kinds of check are structurally identical, so they share one tool each with a check type chosen from a fixed list, rather than a dozen near-identical tools.
Paging is driven by the model: each listing accepts a page number and a page size, capped at 100 and defaulting to 25, and returns the total count so the model can ask for the next page itself instead of the connector walking your entire history.
What it looks at first
Before any model call, the platform pulls your uptime checks and keeps the failing ones, matching them to the incident's service by name, tags, or address where it can. When nothing matches it shows all the failing checks anyway, because "what is down right now" is worth knowing regardless.
Secrets in results
This connector has no redaction rules of its own, and does not need them. What it reads is external monitoring data, not manifests or credential stores.
The one residual case is a token embedded in a contact group's notification address, which the platform's general redaction catches when it is recognisable. That is the same limit that applies to any free-text field.