Prometheus and Alertmanager
Reads your Prometheus over its HTTP API. Alertmanager delivery is a separate, optional capability on the same connection: Alertmanager posts notifications to an endpoint belonging to this connector, and those become incidents.
The read credential and the delivery credential are different. A Prometheus API credential is never reused to authenticate anything inbound.
What it adds to an investigation
Two things, and they are independent. Reading lets an investigation ask your metrics questions. Delivery lets a firing alert open an incident that already knows when it started and when it cleared.
How it is wired
flowchart LR
    Am["Alertmanager"] -->|"pushed to a delivery<br/>endpoint, optional"| Incident["An incident that knows when<br/>the alert fired and cleared"]
    Incident --> Ask["The investigation<br/>asks for numbers"]
    Ask --> Tools["Read-only tools"]
    Tools --> Prom["Prometheus read API"]
    Prom --> Thread["Evidence in the<br/>incident thread"]
Two paths, two credentials, and either one works without the other. Prometheus itself is never polled: reads happen only while an investigation is running. Delivery is what gives an incident its real firing and recovery times, rather than the time a human noticed.
Before you start
| You need | Why |
|---|---|
| A Prometheus address the platform can reach | A private network address is allowed here |
| One authentication method, from the table below | Saving without one is rejected |
| Your certificate authority, for a self-signed certificate | Server trust is separate from authentication |
| An Alertmanager receiver you can edit, for delivery | Optional. You can connect reads only |
Address and transport
Prometheus is self-hosted and usually lives on a private network, so a private address is allowed
here. Loopback, link-local, and cloud metadata addresses are refused. During local development the
supervised tunnel on http://127.0.0.1:9090 is admitted; a deployed process never admits it.
Plain HTTP has no encryption and requires you to acknowledge that during setup. Use it only through that tunnel or on a trusted private network, and use HTTPS whenever credentials or monitoring data cross anything else. Mutual TLS requires HTTPS.
Requests carry the credential in a header and never in the address, time out after eight seconds, and refuse redirects.
Authentication
Prometheus has no single authentication convention, so pick the one your deployment uses.
| Method | What you supply | How it is sent |
|---|---|---|
| None | Nothing | Unauthenticated, for a bare in-cluster Prometheus |
| Bearer token | A token | An Authorization header. Grafana Cloud, Thanos, an OAuth proxy |
| Basic | A username and password | An Authorization header. An nginx-fronted Prometheus |
| Custom header | A header name and value | That header. Cortex and Mimir tenant headers, API-key proxies |
| Client certificate | A certificate and key | Presented during the TLS handshake |
A client certificate over plain HTTP is rejected. Amazon Managed Prometheus, which signs requests, is a documented future addition to the same set.
Server trust is separate, because a Prometheus behind basic authentication can still serve a self-signed certificate. Pin your own certificate authority, or explicitly choose to skip verification.
Connect it
Open Connections, choose Add connection, then Add Prometheus & Alertmanager. Five steps, and the last three exist only because delivery is optional. The catalog and the shape every wizard shares are in Set up a connector.
1. Metrics endpoint
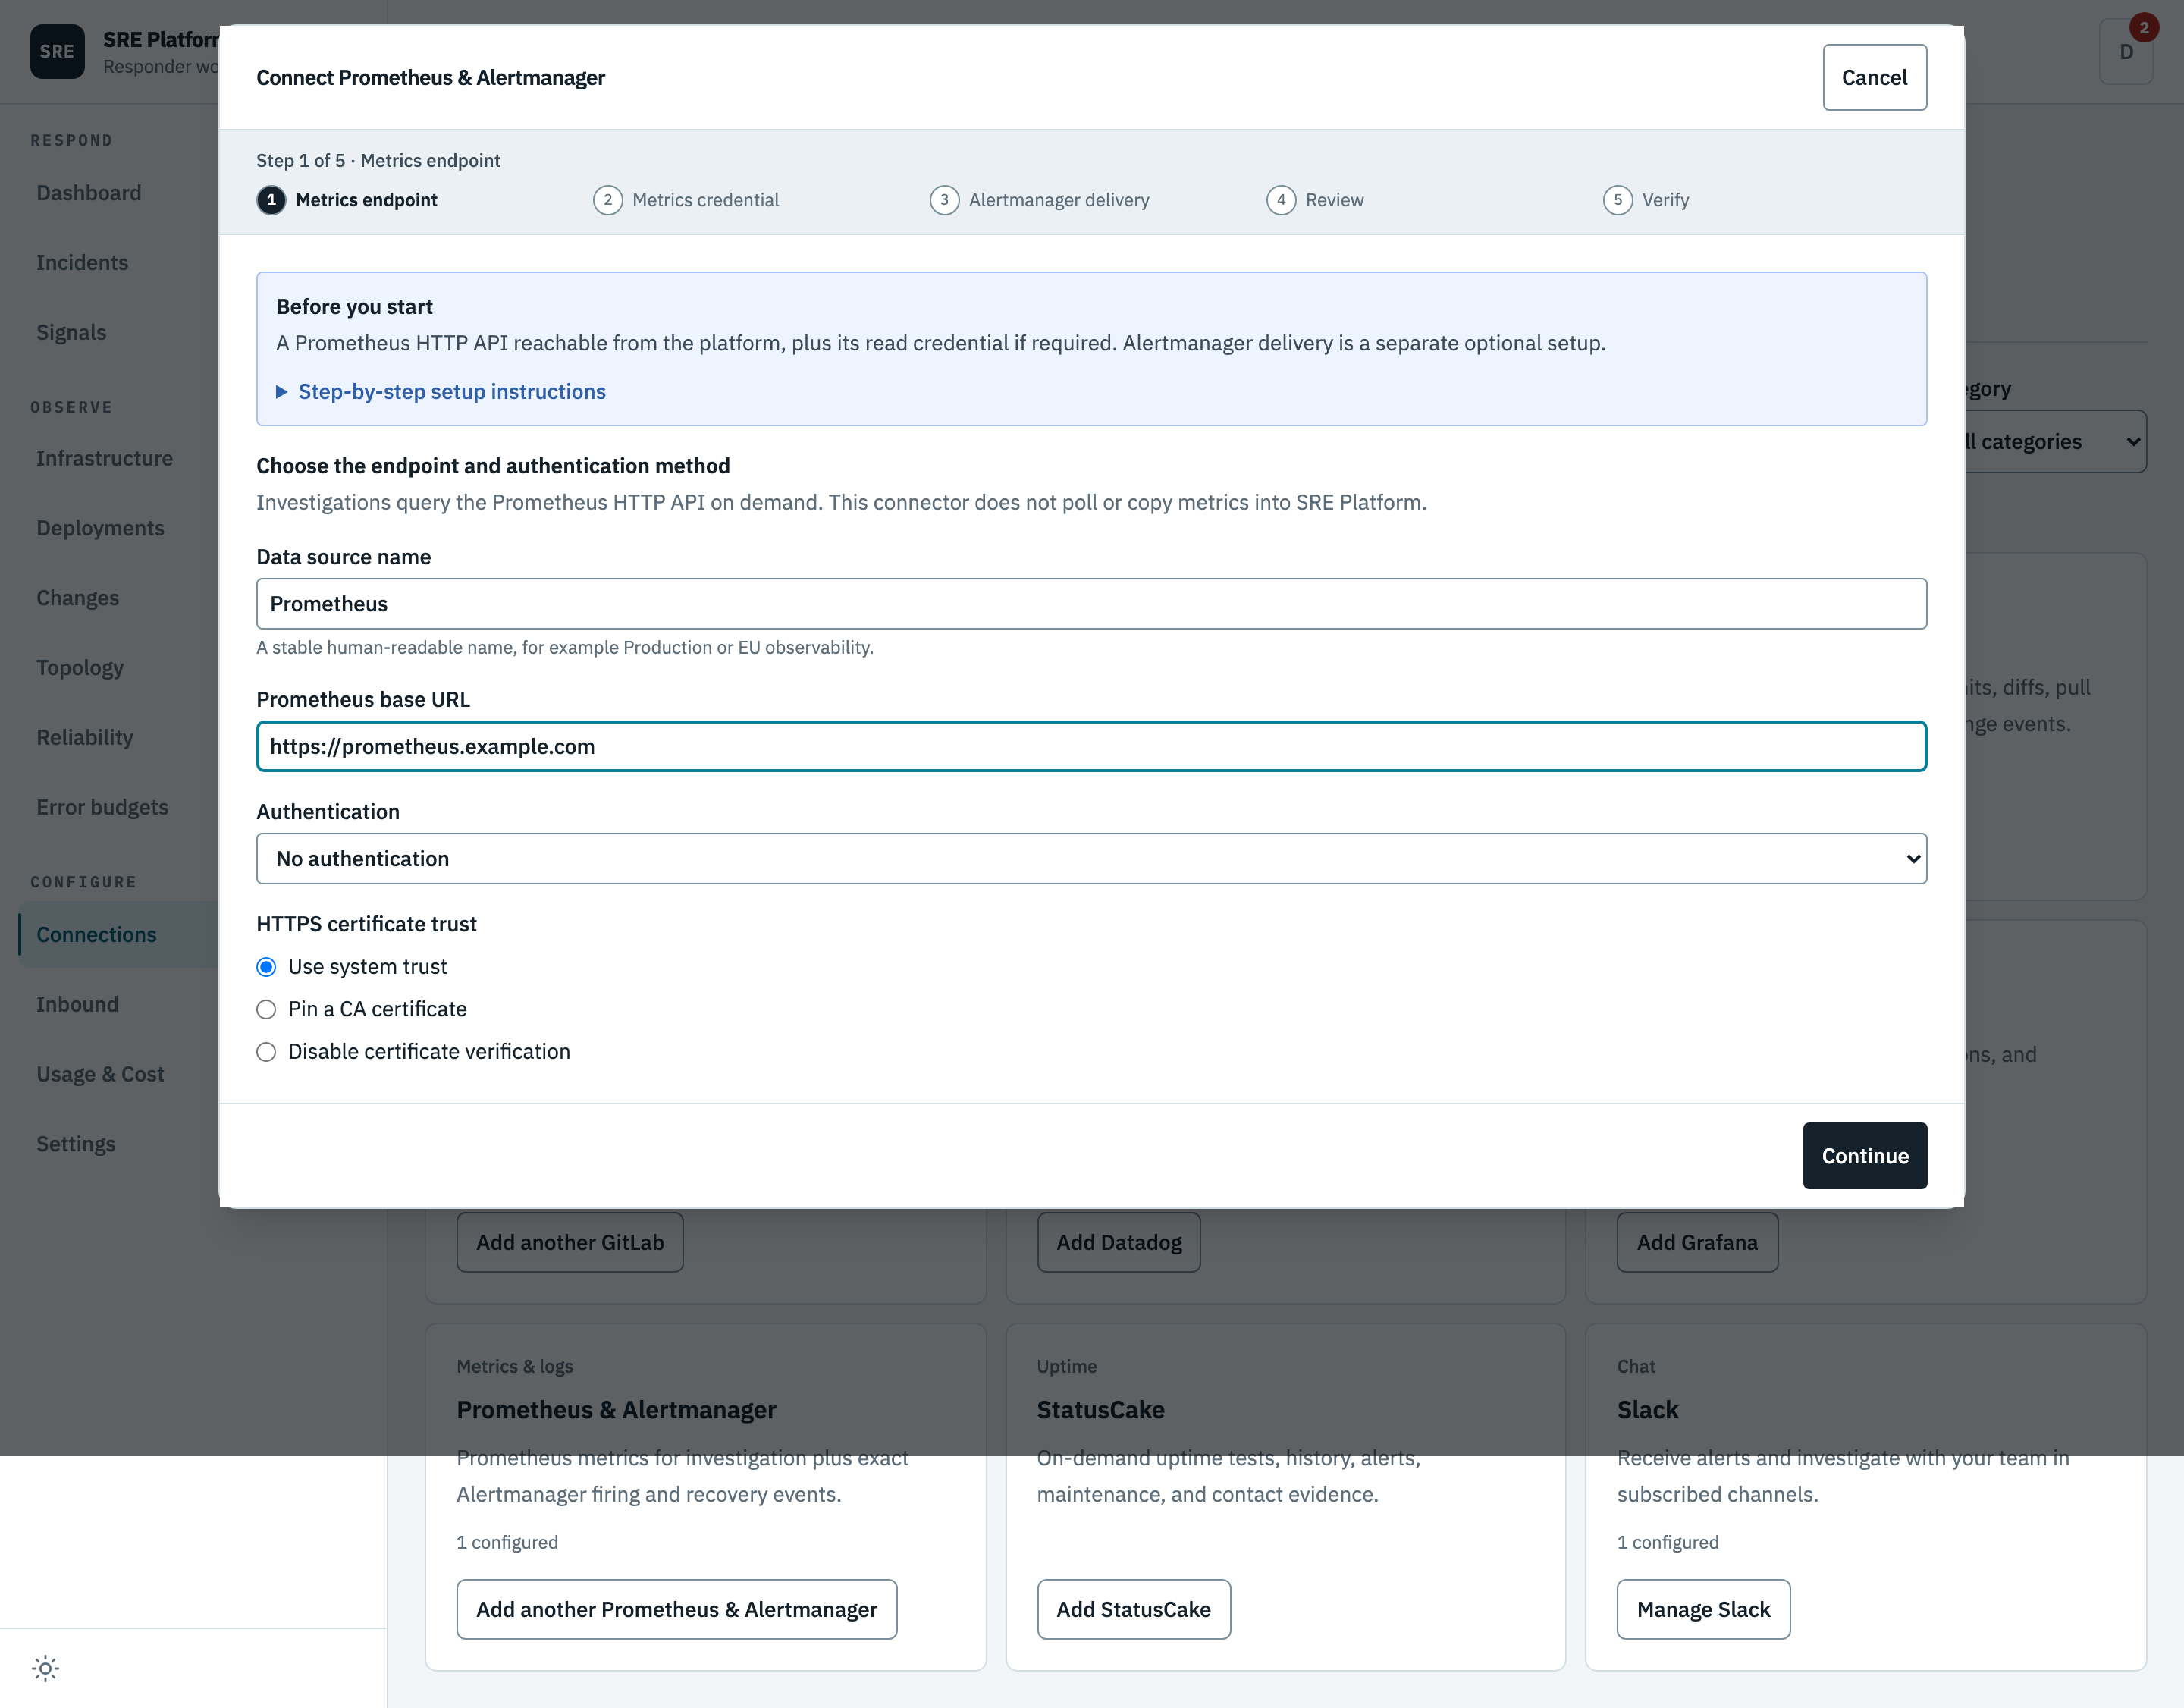
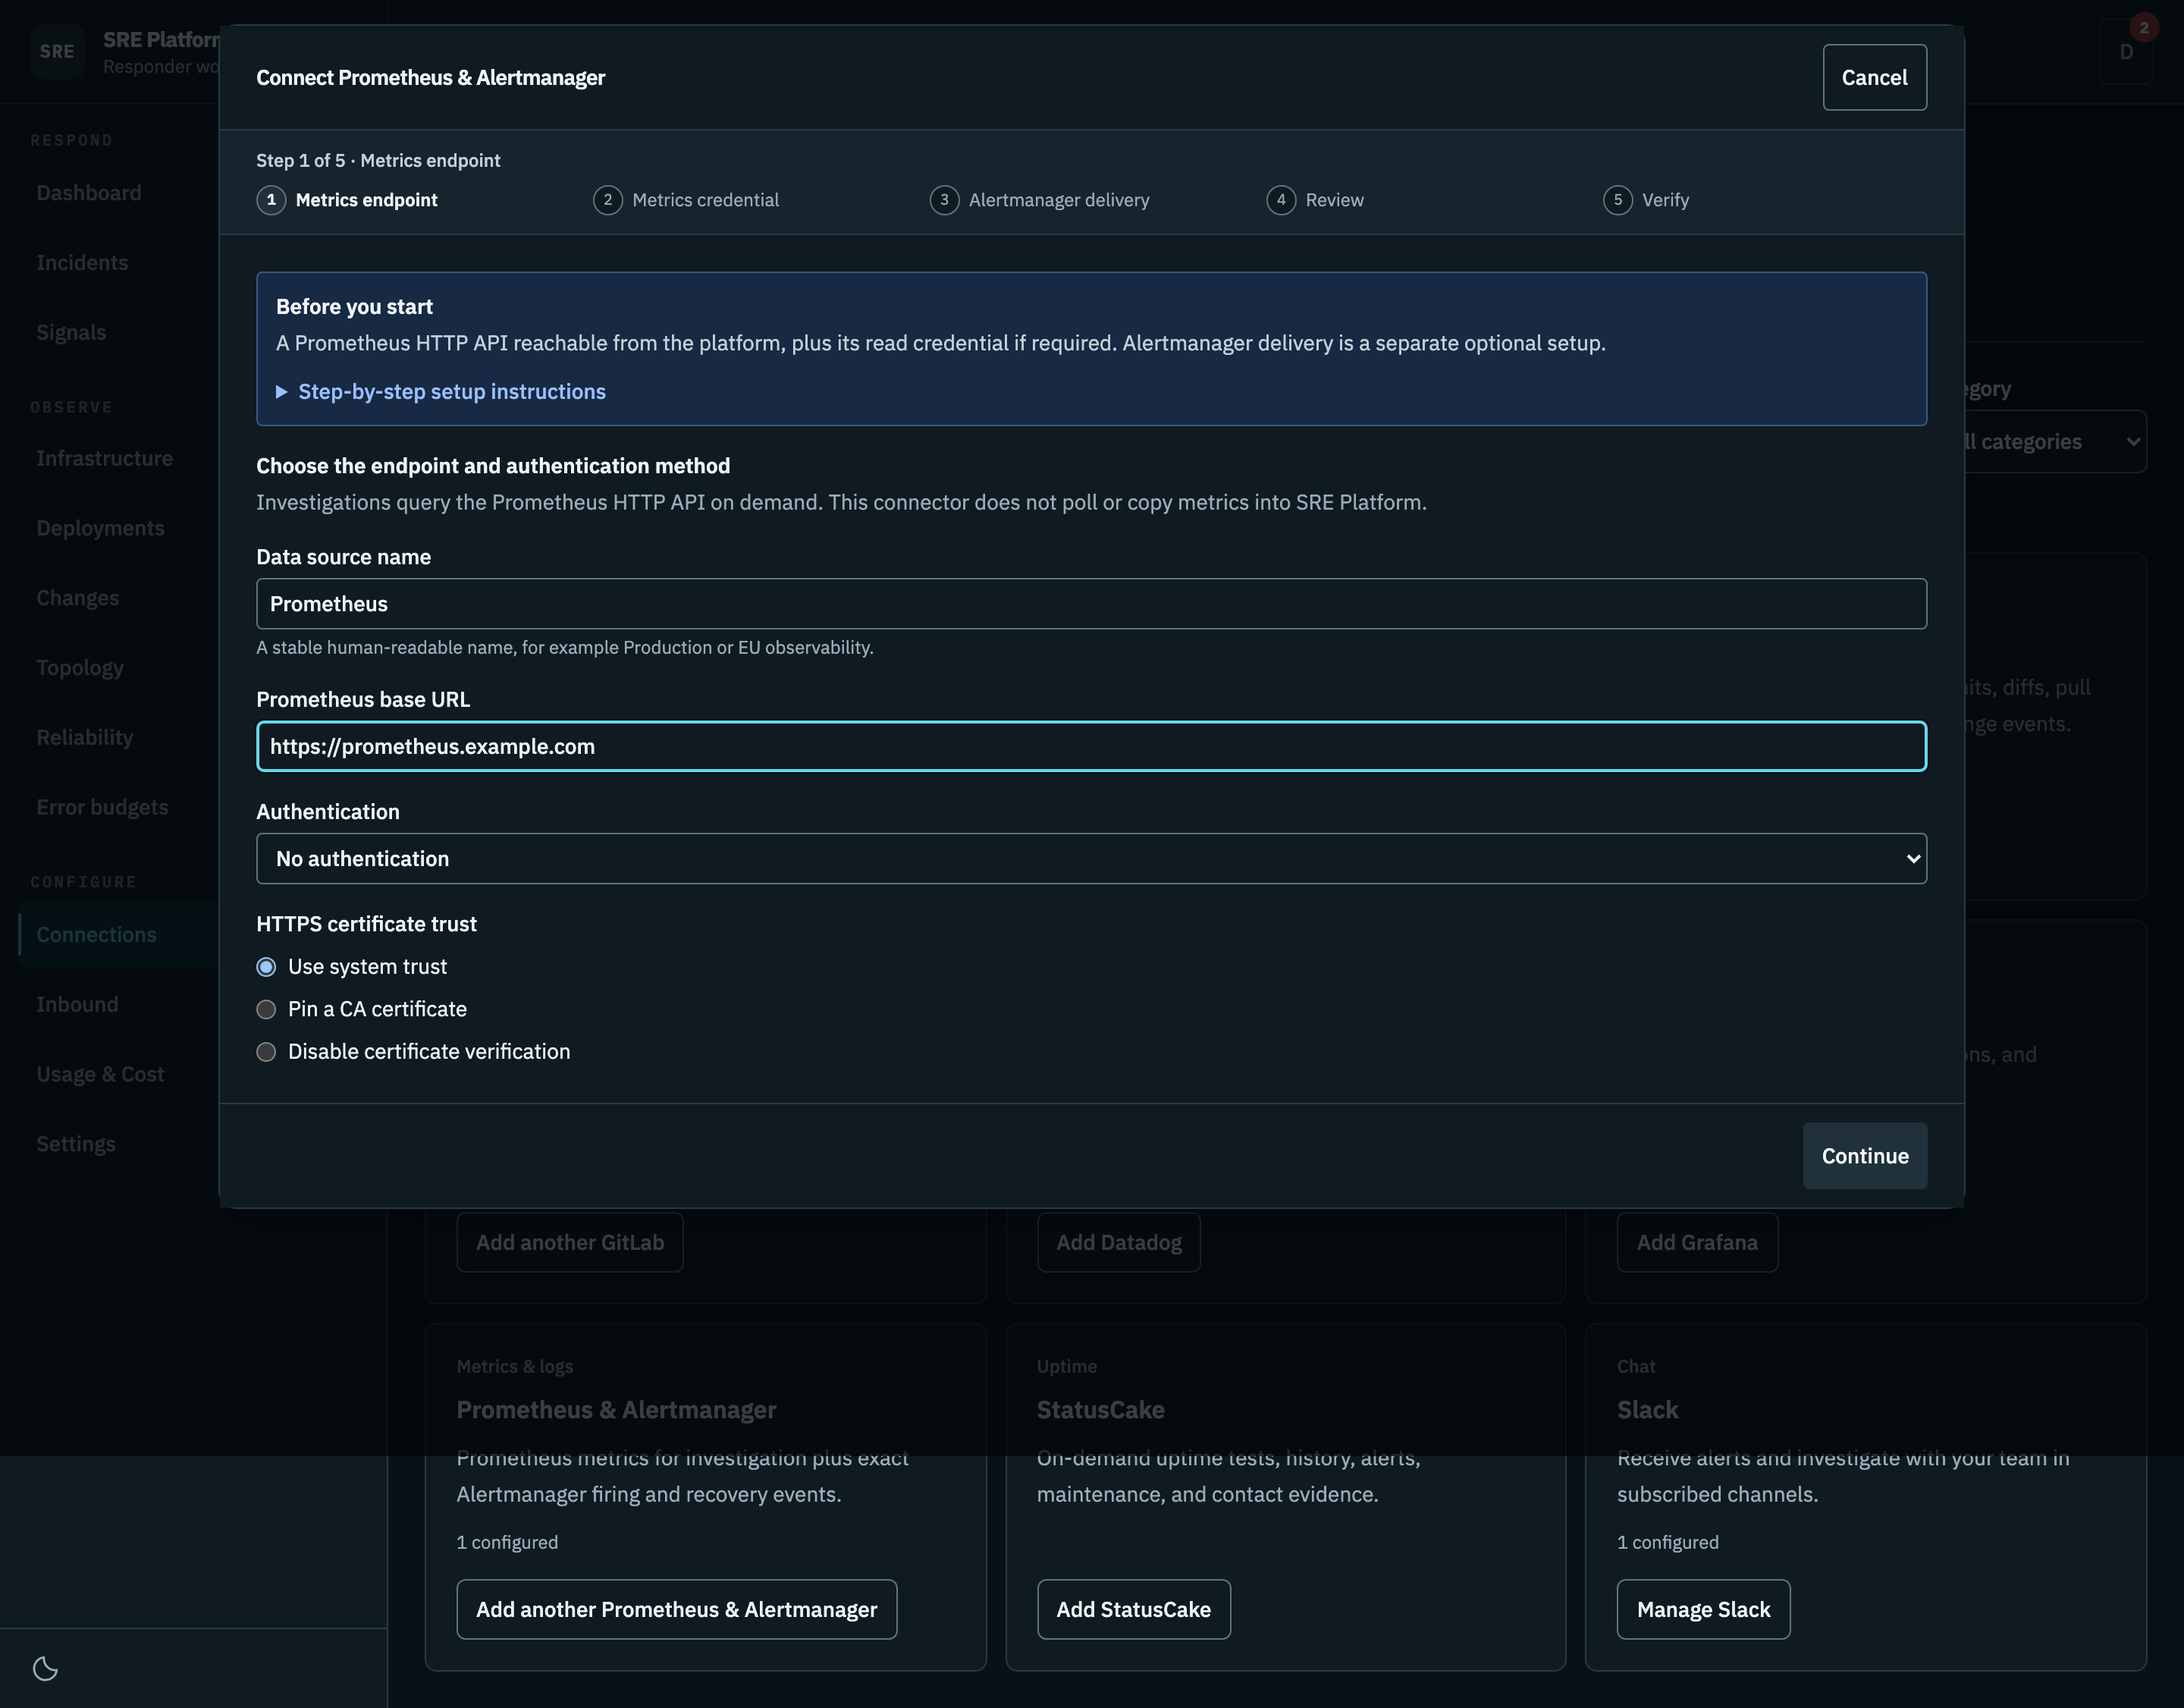
The address and the authentication method. A private network address is allowed here, because Prometheus is usually self-hosted. The wizard says plainly that investigations query this endpoint on demand and that nothing is polled or copied.
2. Metrics credential
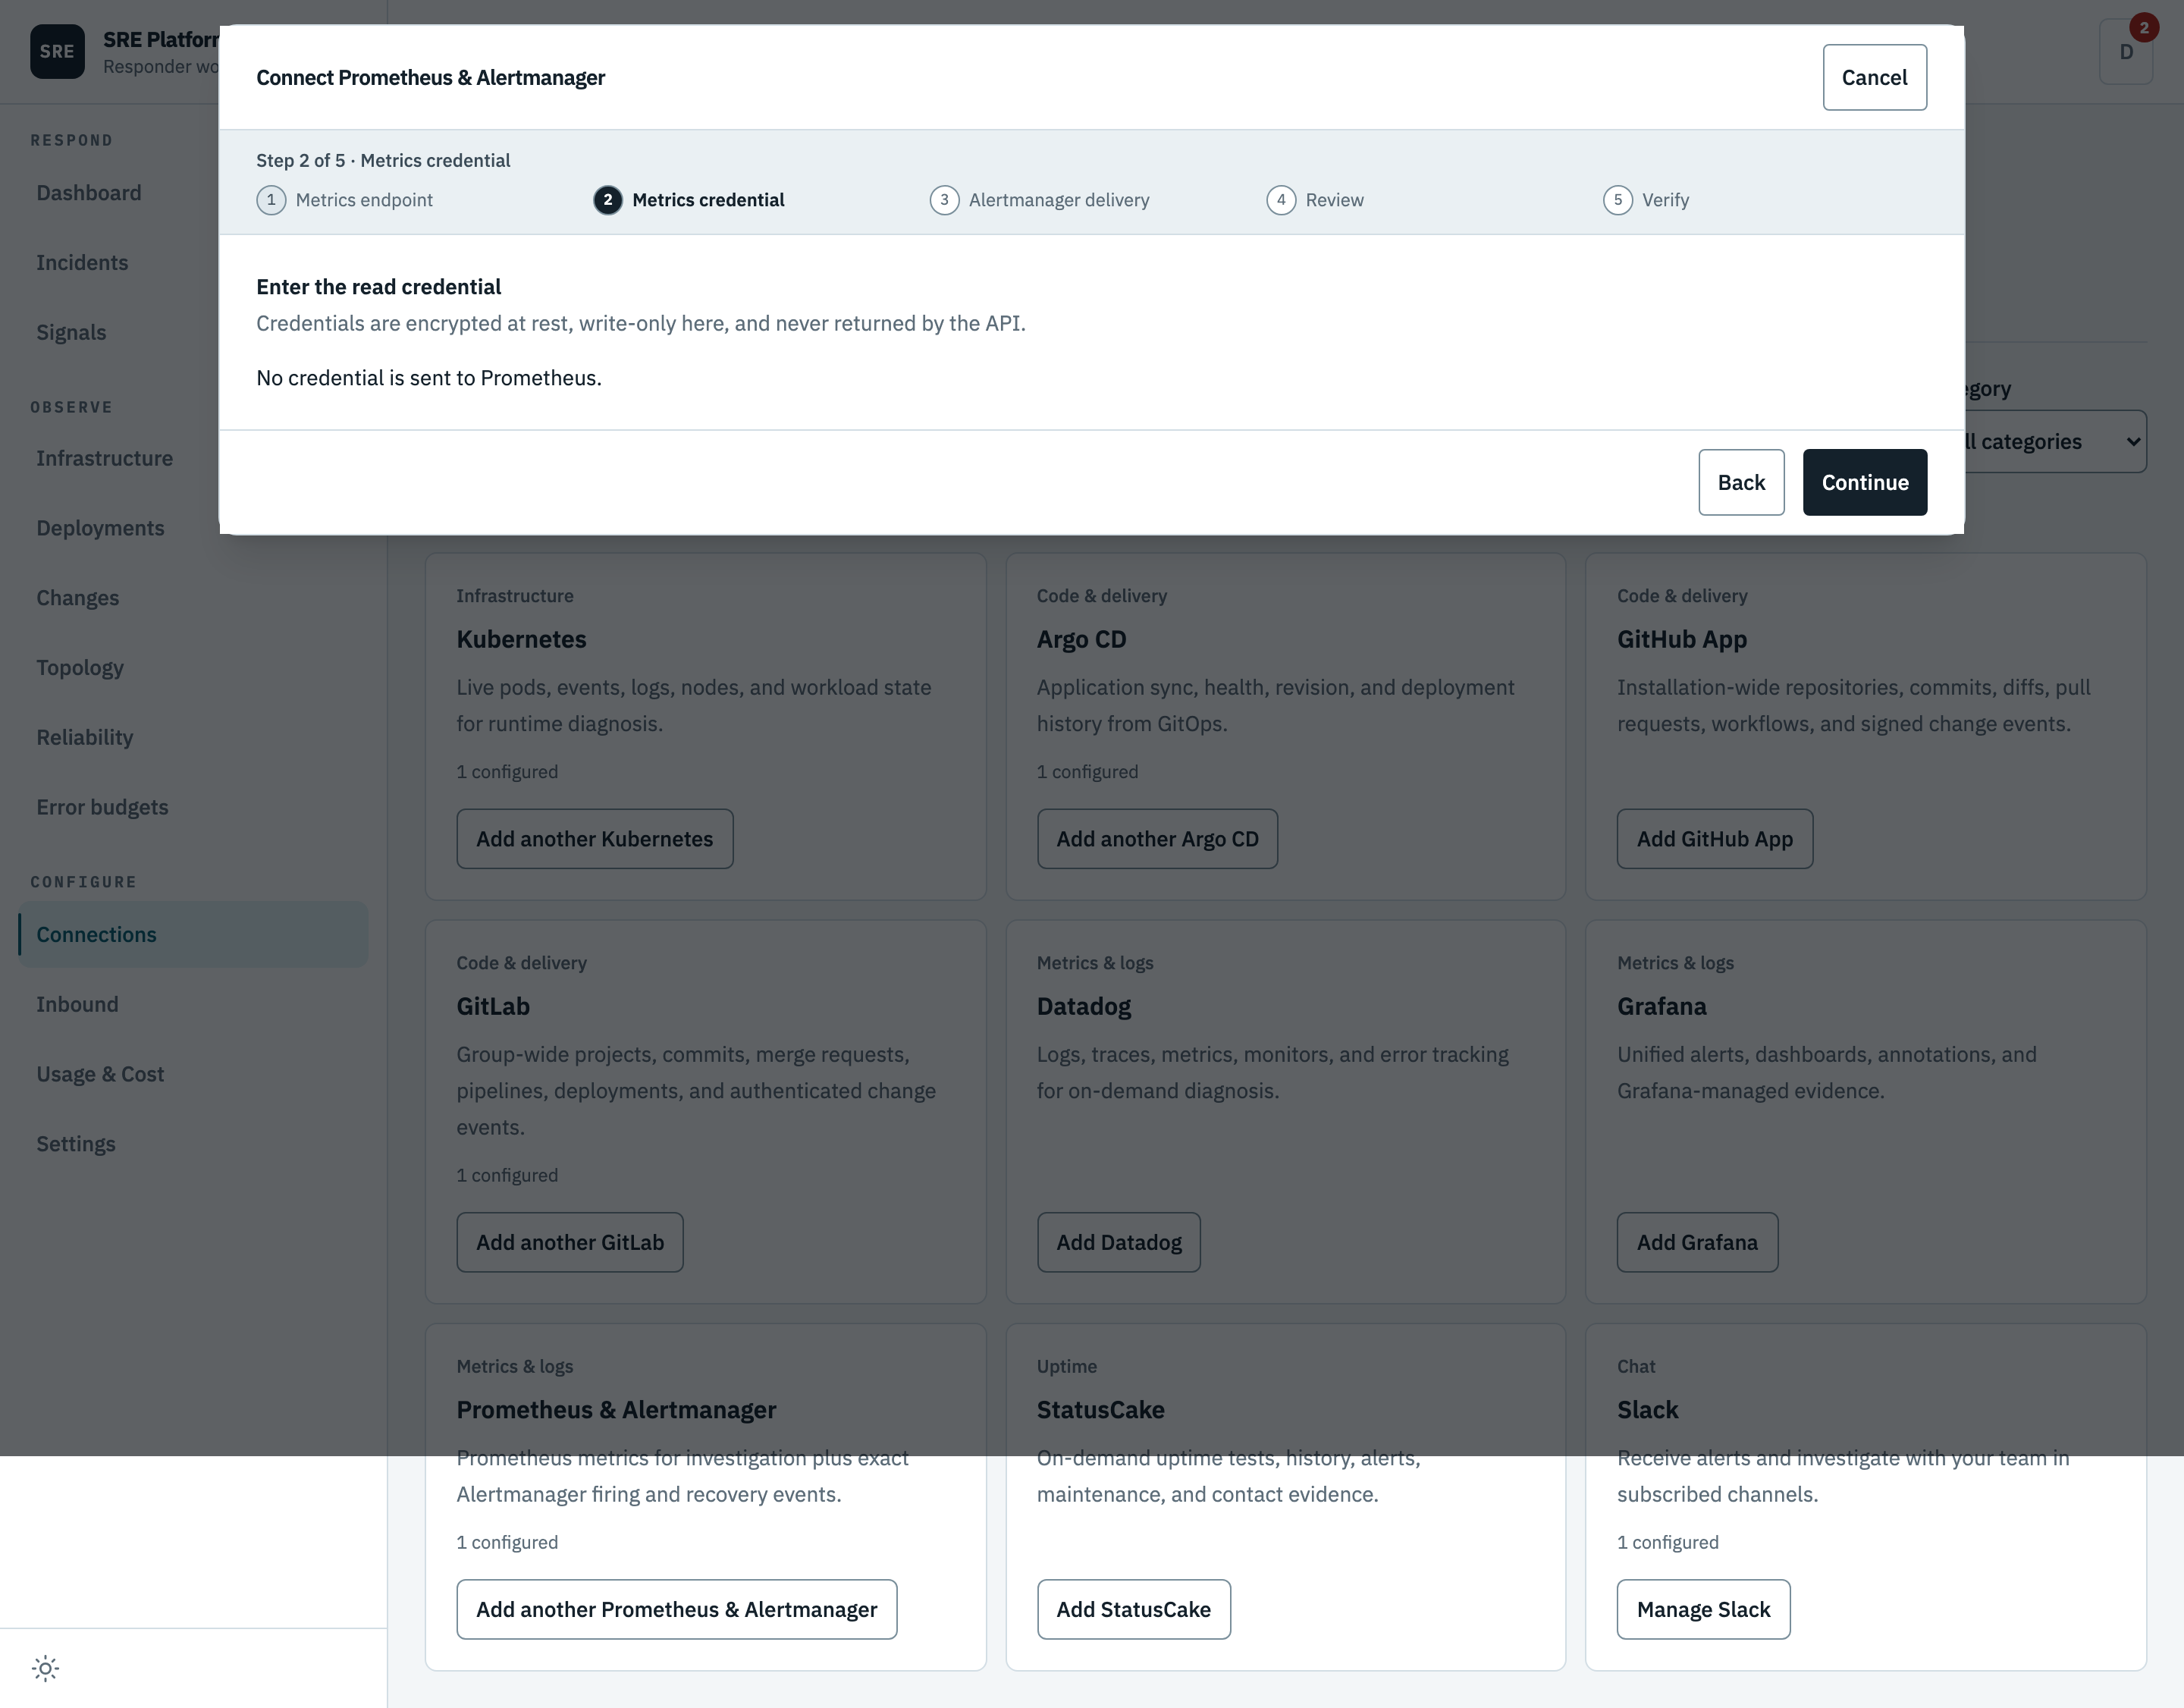
The secret for the method you picked, plus a certificate authority if your server uses one. If you chose no authentication there is nothing to enter.
3. Alertmanager delivery
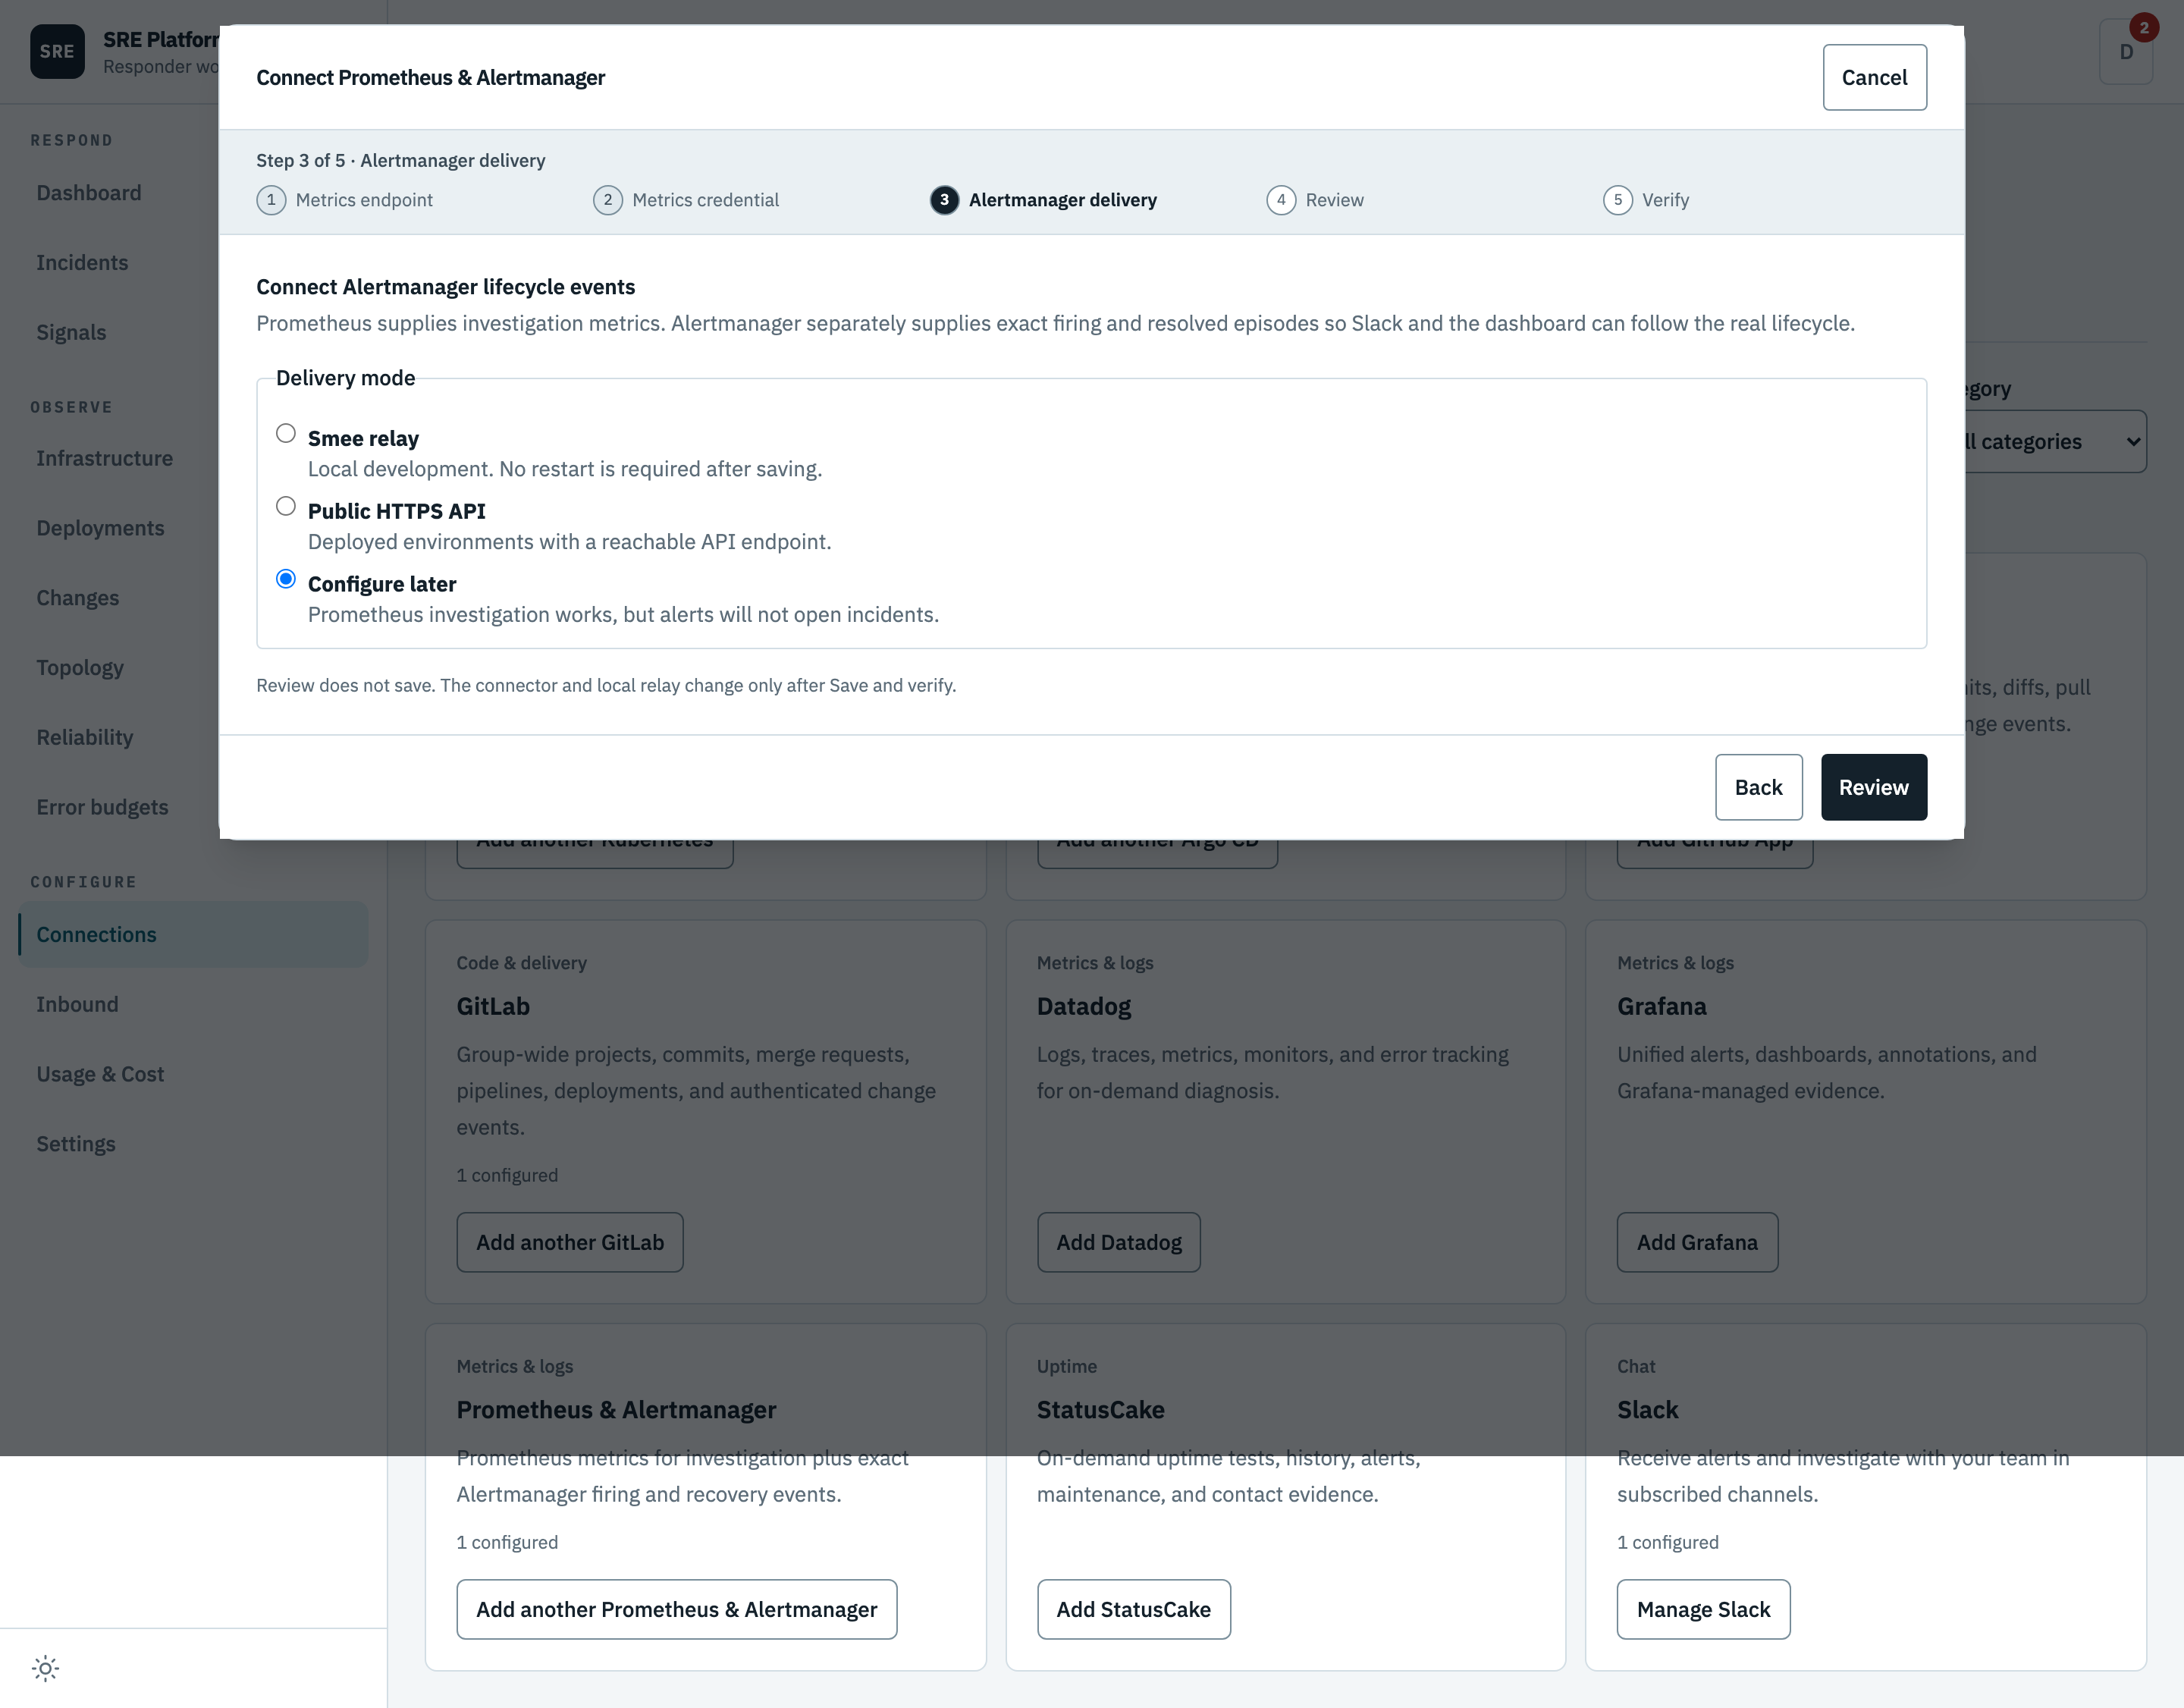
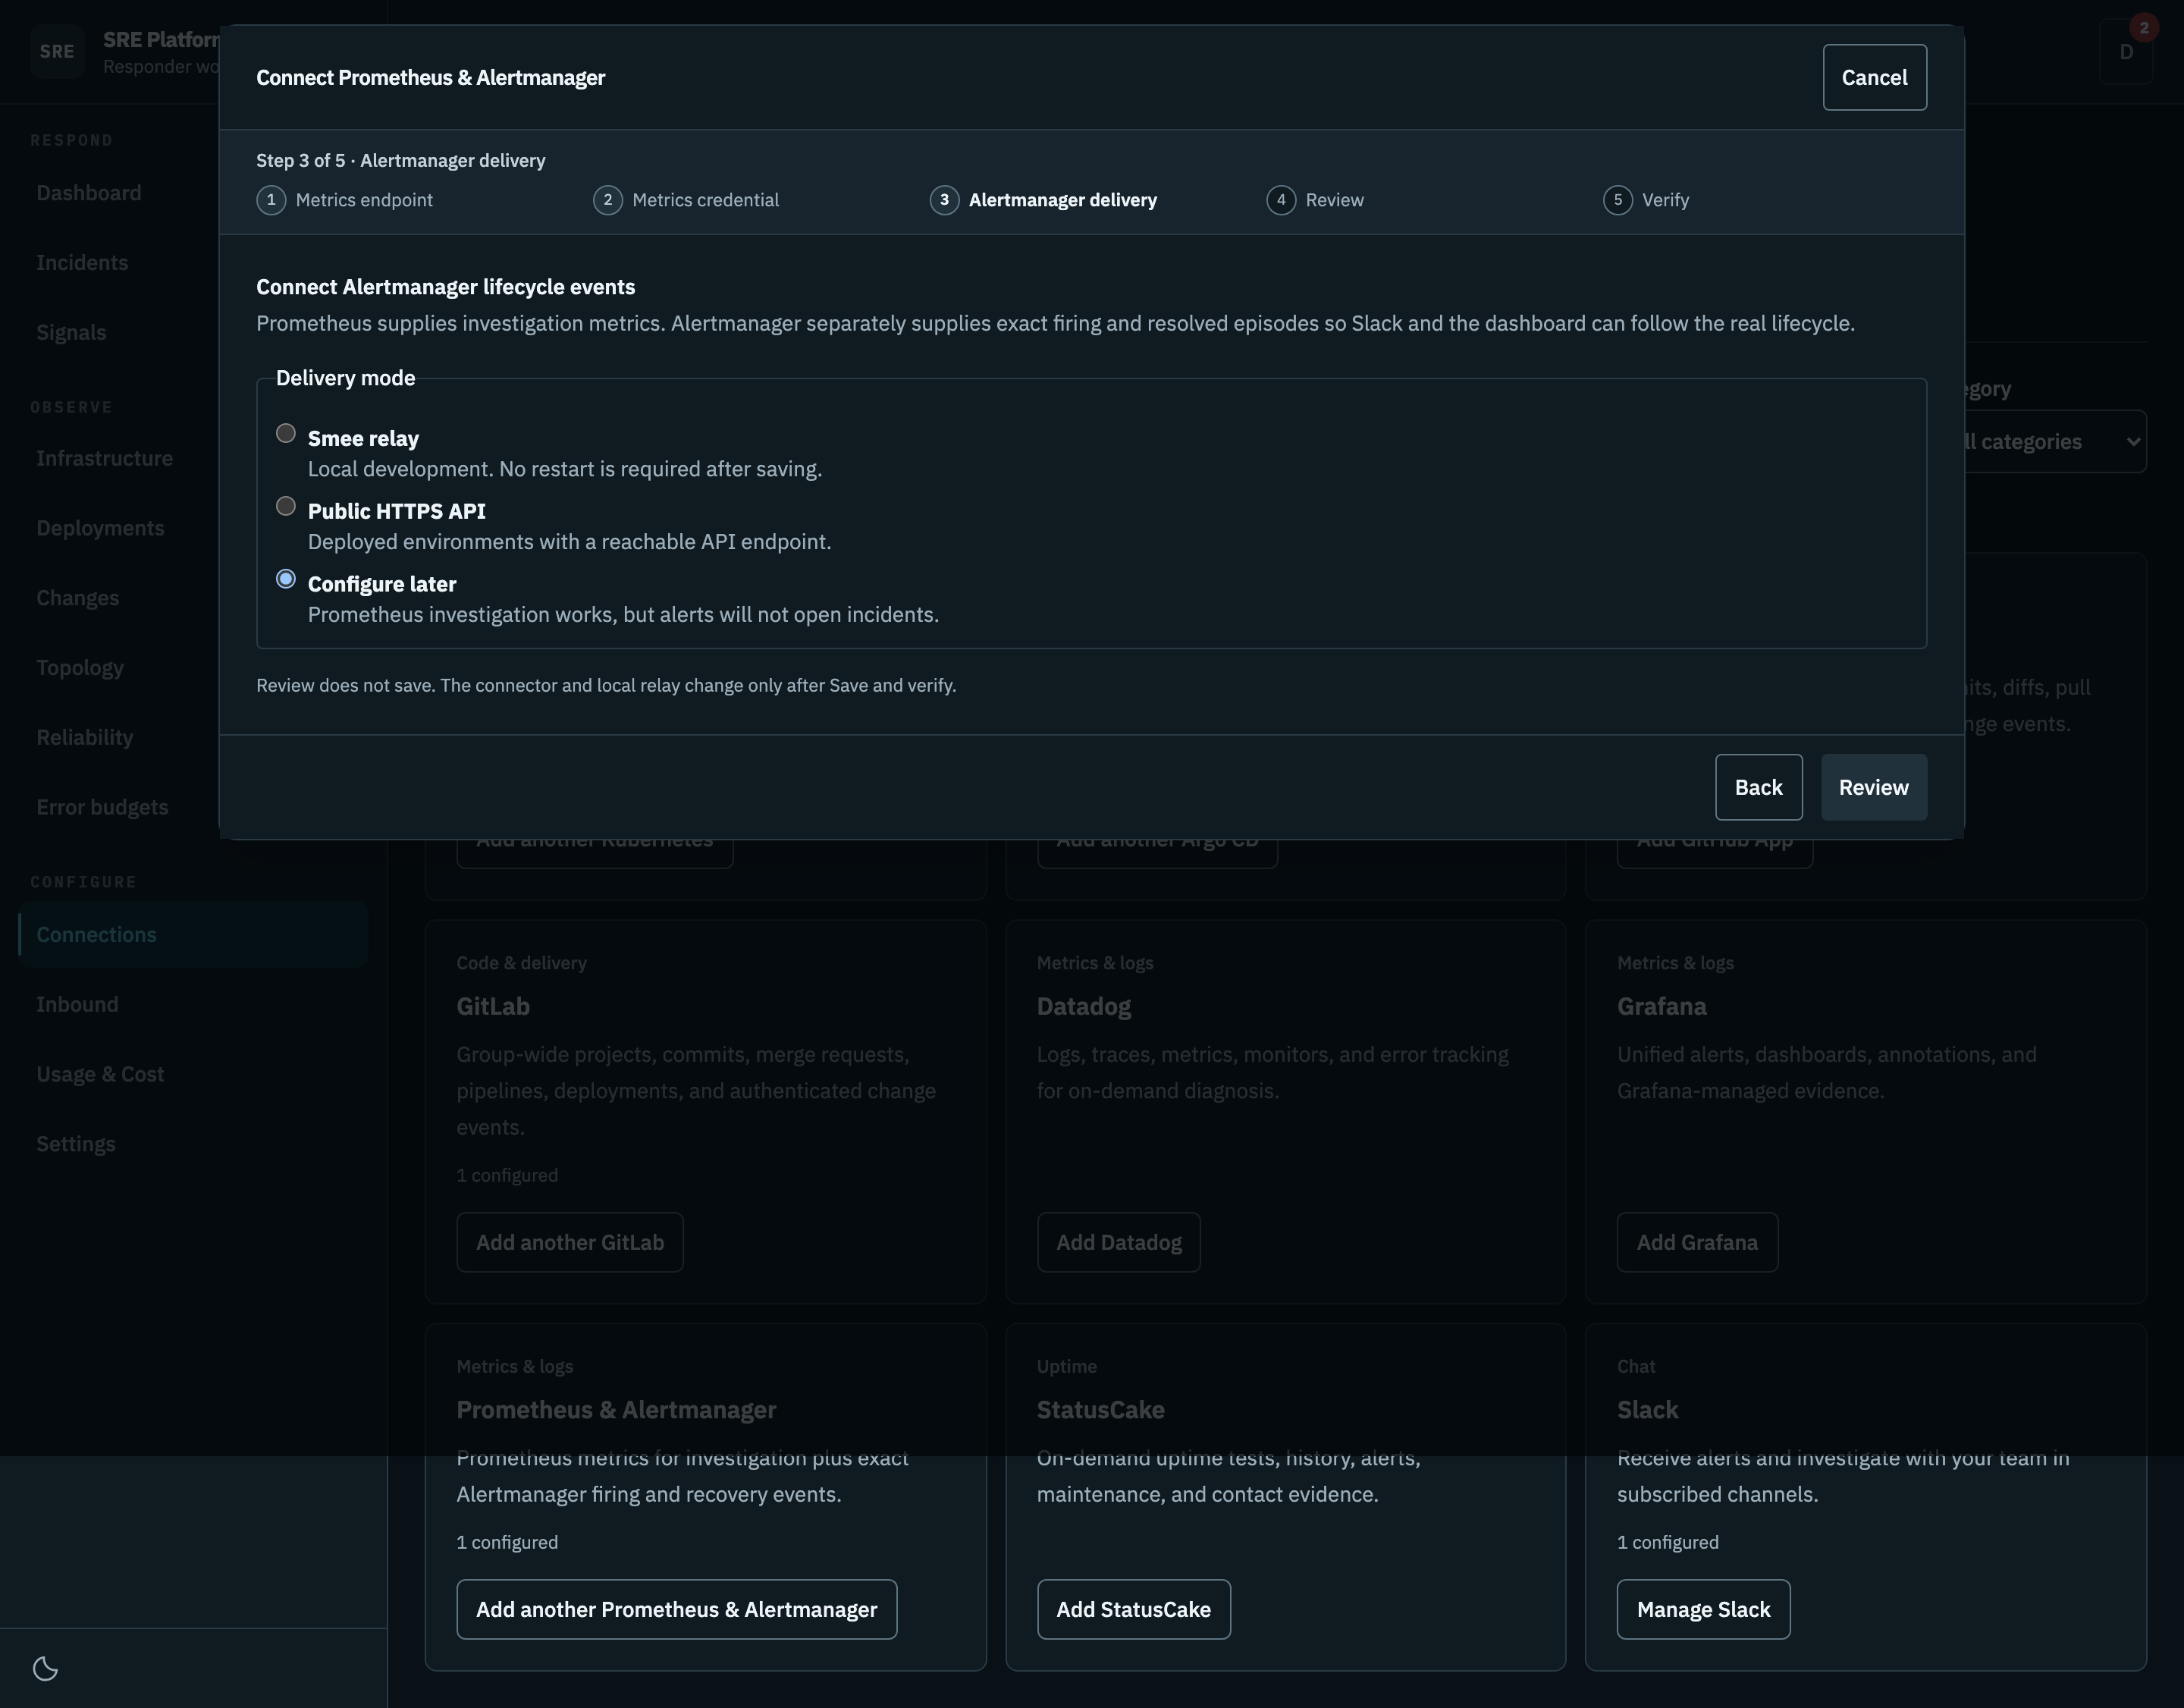
Independent of reading, and genuinely optional. Choosing a delivery mode gives Alertmanager an endpoint to post to, which is what lets a firing alert open an incident that already knows when it started and when it cleared. Configure later leaves reading fully working and alerts simply not arriving.
Once you pick a mode, the step also states the episode policy, because it is not something you configure: each provider episode opens its own incident and its own Slack thread, and episodes that arrive close together are compared afterwards rather than folded into one workspace.
4. Review
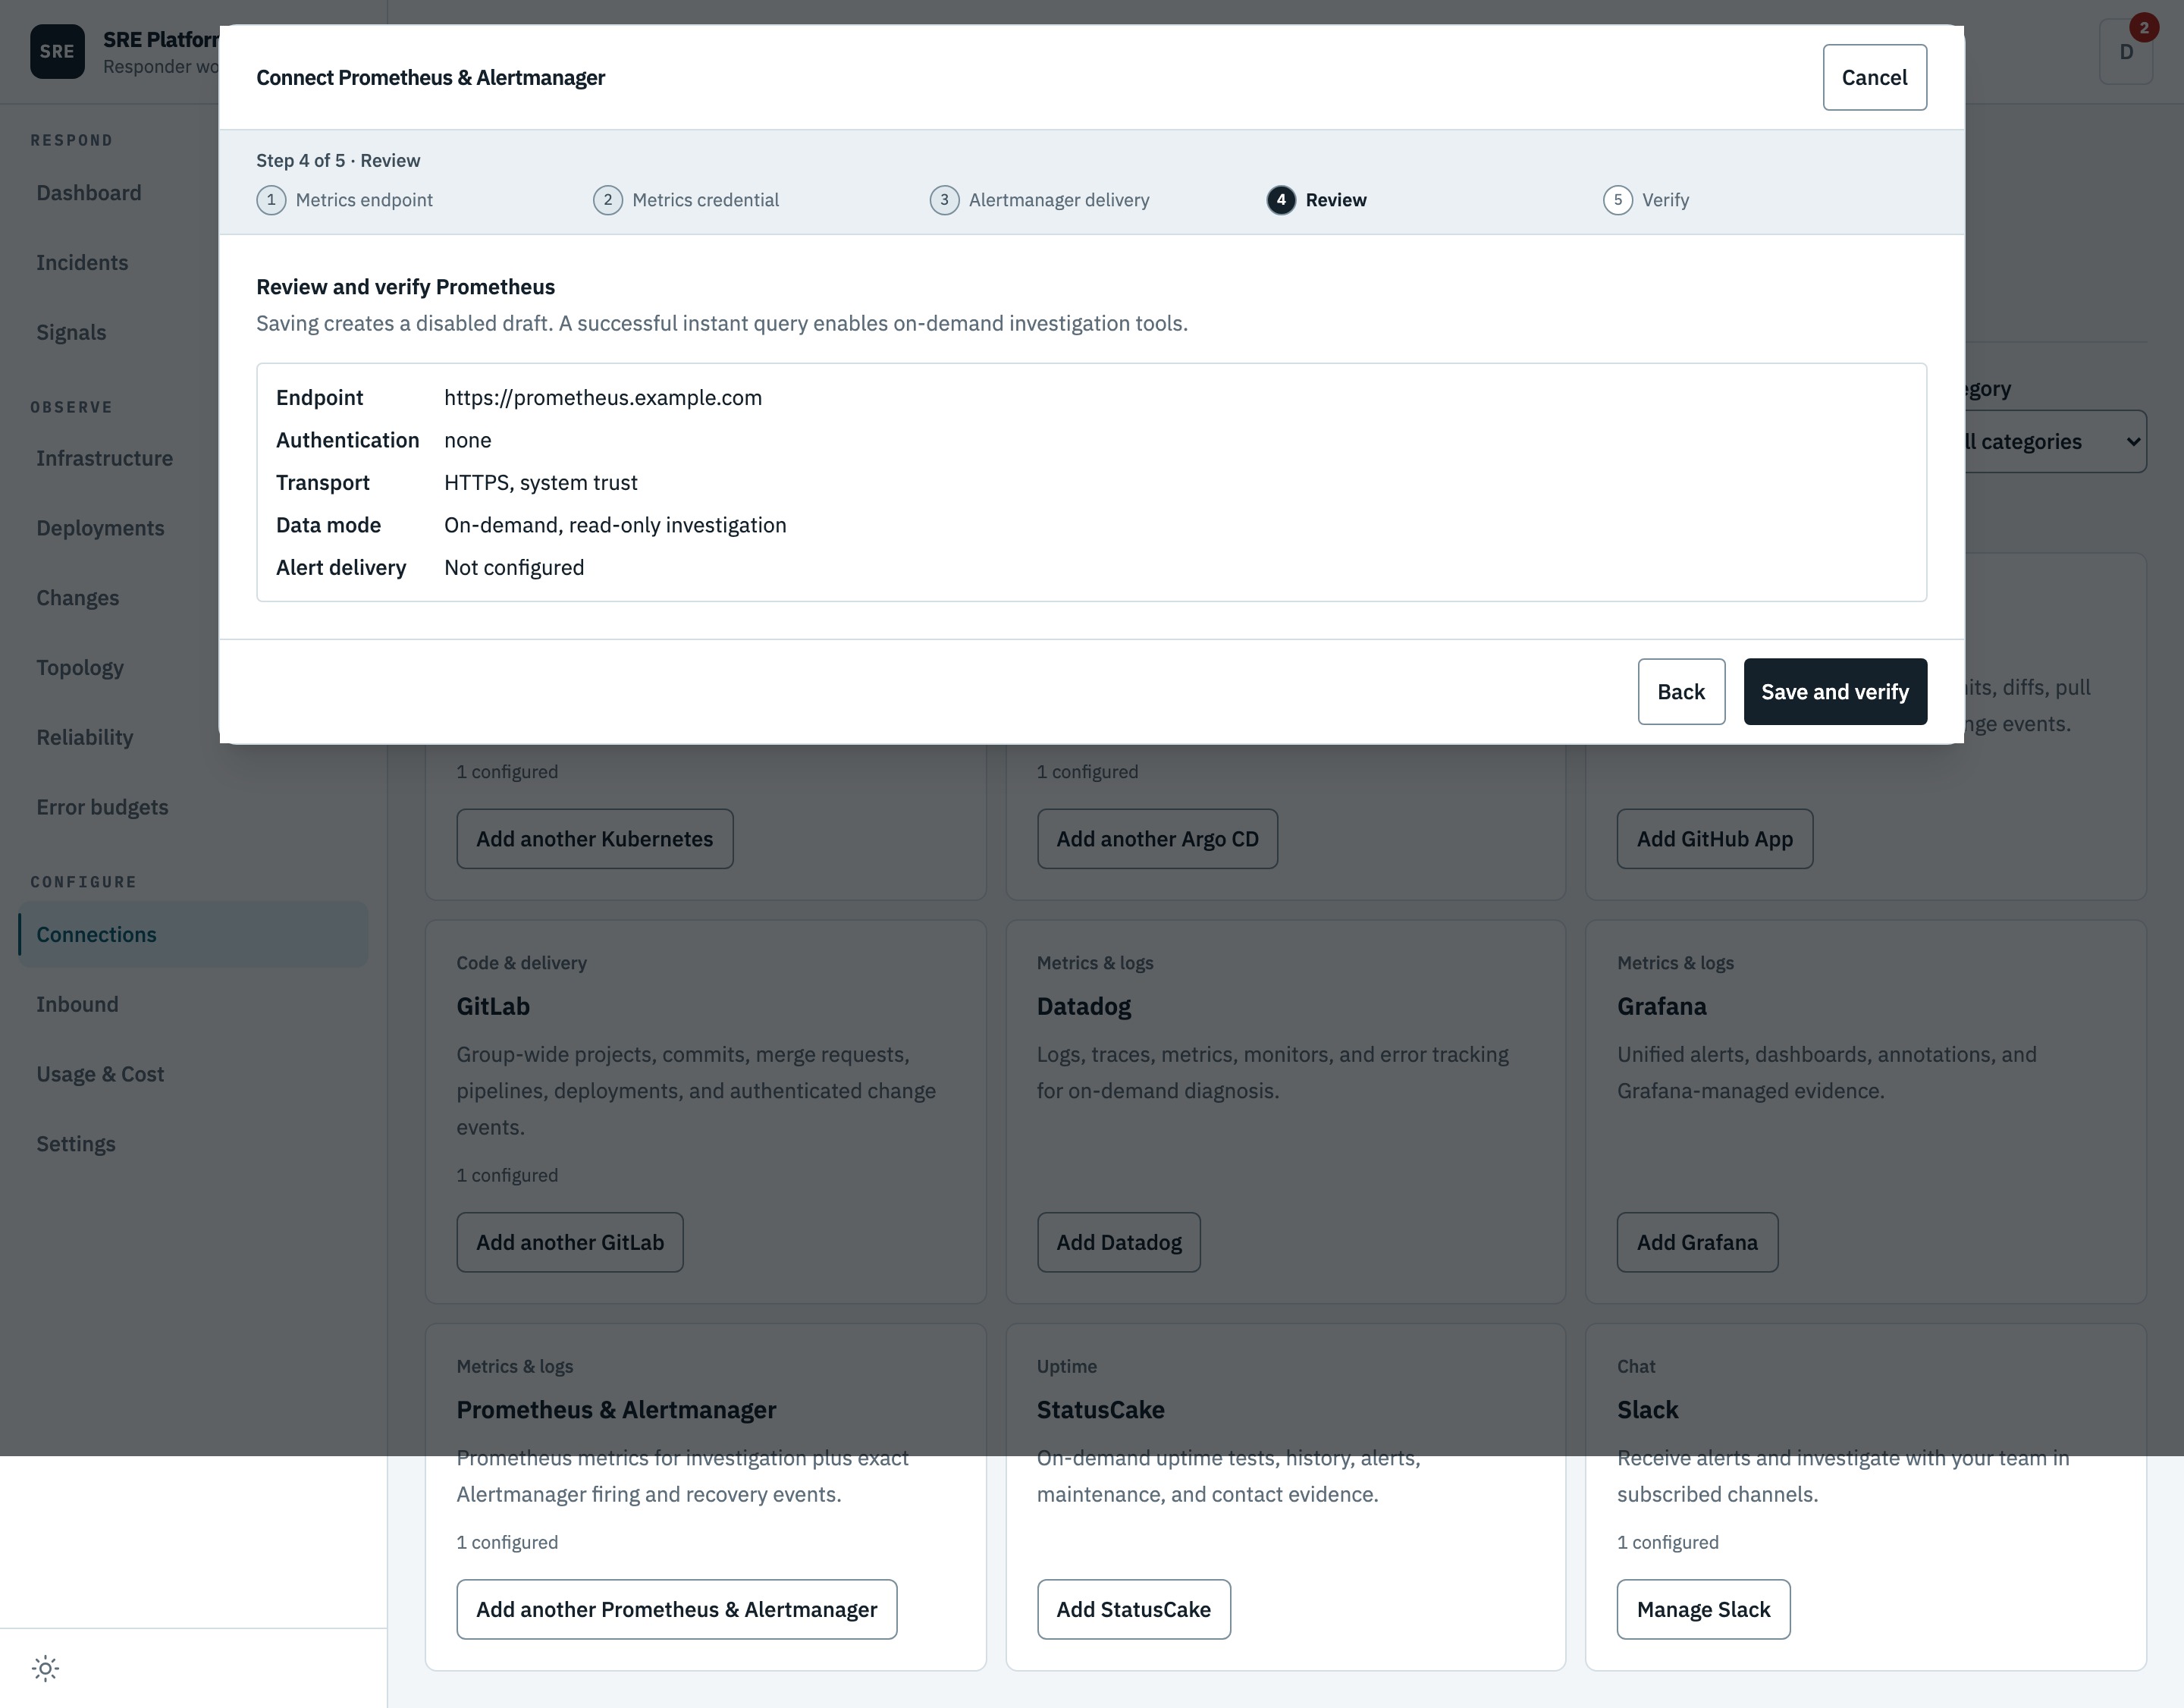
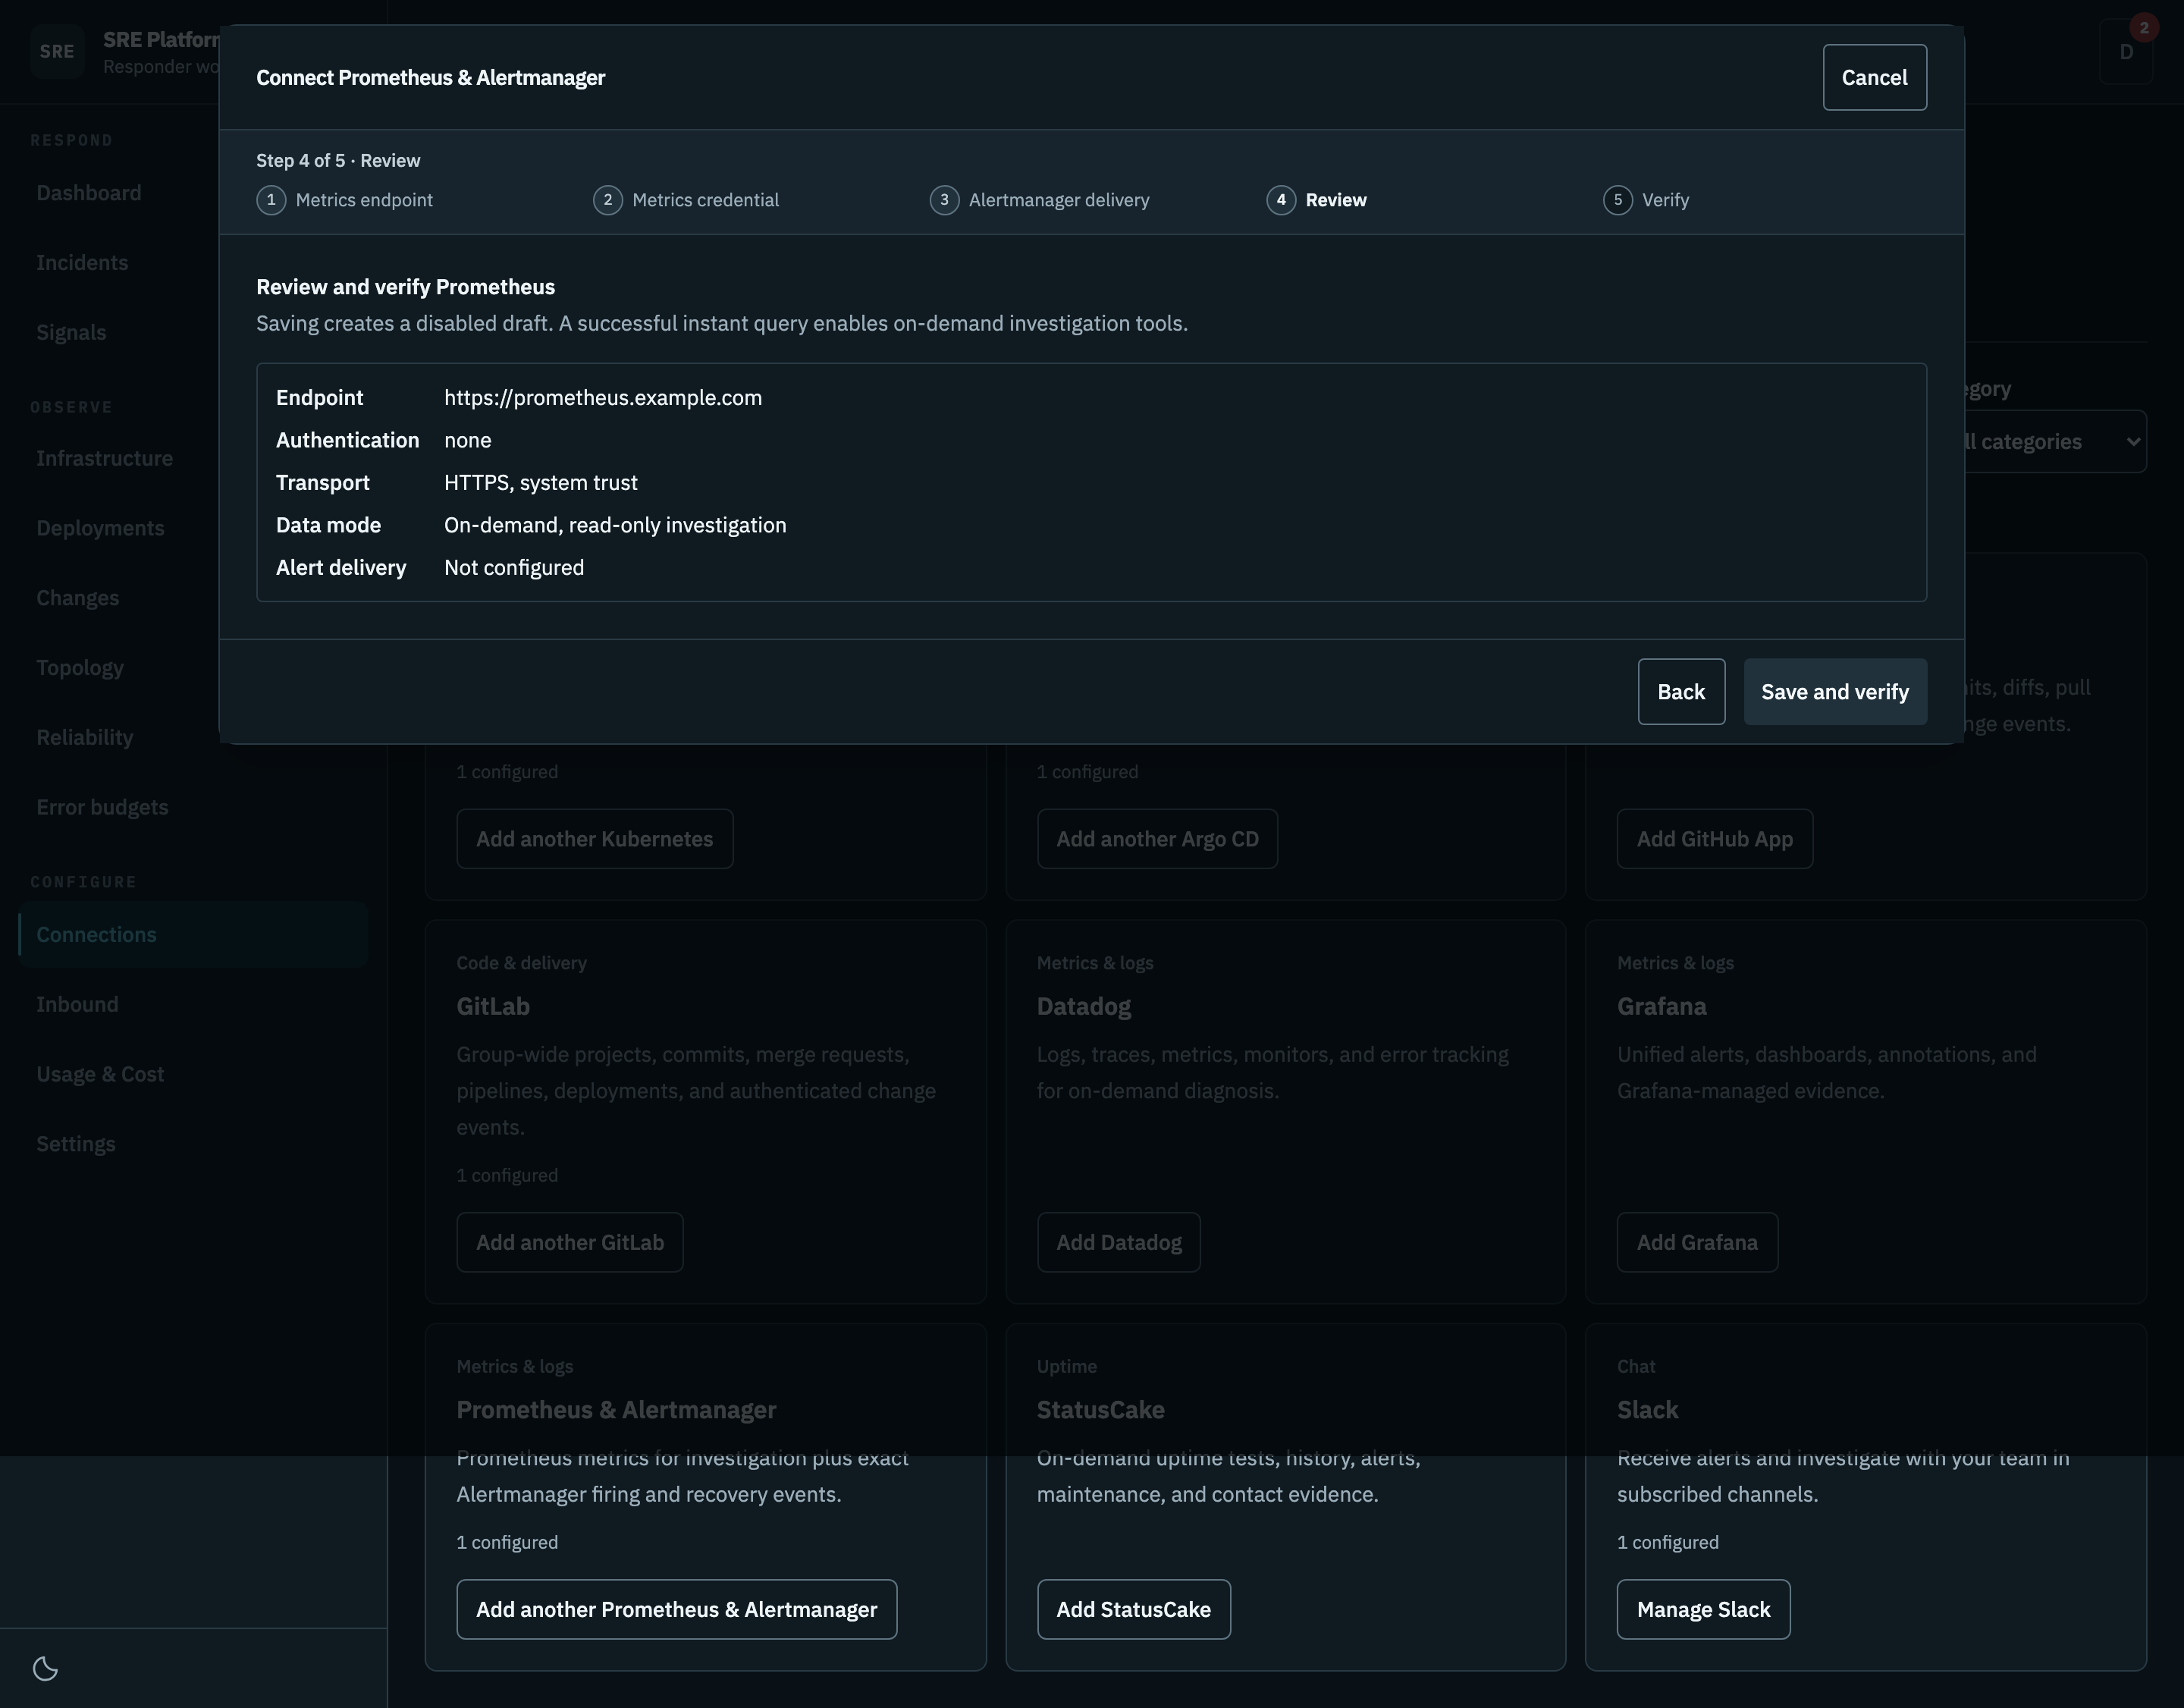
Settings only. Review does not save: the connector and any local relay change only after the next step.
5. Verify
The credential is encrypted before it is stored. Verification runs a trivial query, and the connector is switched on only if it succeeds.
This step runs against your real system, so it is not pictured here.
What it can read
| Tool | What it does |
|---|---|
query |
Evaluate an instant PromQL query at a single time (current value / snapshot). query is PromQL (e.g. "up", "rate(http_requests_total[5m])"). Optional time (ISO 8601 or relative like now-5m; defaults to now). Anchor time to the incident onset, not the current time. |
query_range |
Evaluate a PromQL query over a time range (a series). query is PromQL; start/end are ISO 8601 or relative (now-1h); step is a resolution like "15s"/"1m" (defaults to ~250 points across the window). Anchor start/end to the incident onset. Returns a matrix of series. |
series |
Find series matching label matchers. match is one or more selectors (e.g. ["up", "{job=\"api\"}"]). Optional start/end (ISO 8601 or relative). Use to discover what series exist. |
labels |
List label names, optionally constrained by match selectors and a time range. Use to discover the label schema (e.g. what dimensions exist). |
label_values |
List the values of one label name (e.g. name="job" → all job values). Optionally constrained by match selectors. |
metadata |
Read metric metadata (type, help text, unit). Optional metric to filter to one name; optional limit. Use to understand what a metric measures. |
targets |
List scrape targets and their health (up/down, last scrape, errors) — the "what is not being scraped" signal. Optional state: "active", "dropped", or "any" (default active). |
rules |
List alerting and recording rules and their current state. Optional type: "alert" or "record". |
alerts |
List the alerts currently firing (and pending) — the "what is on fire right now" signal. |
api_get |
GET any Prometheus HTTP API endpoint by path (e.g. "api/v1/status/config", "api/v1/status/runtimeinfo", "api/v1/alertmanagers", "api/v1/targets/metadata"). Read-only. Use for anything the named tools do not cover. |
Nothing here can change anything. The two query tools send their parameters in a request body, which avoids the length limit on long queries, but they post to one fixed read path. The general-purpose tool is read-only, confined to the API path, and normalised so that a relative path cannot escape it. No tool accepts an HTTP method, and the endpoints that would delete data need methods no tool can use.
Time ranges accept either an exact timestamp or a relative expression such as now-1h, anchored to
when the incident started.
Alertmanager delivery
During setup you choose how notifications reach the platform: a public HTTPS endpoint in a deployed environment, a relay in local development, or nothing at all. Choosing nothing is valid, and the connector card then says event delivery is not configured rather than looking complete.
You get a copyable block to add to the Alertmanager receiver that already routes the alerts you care about. Add it to that receiver. Do not change its name, its Slack configuration, or your routing tree.
Saving stores a draft that is switched off. A successful verification switches it on and starts delivery. The connector card reports read access and delivery health separately, so a connection that can only query cannot appear fully configured.
The endpoint rejects anything unauthenticated, malformed, oversized, truncated, or of an unexpected version.
What a notification does
A grouped notification is split into separate alerts. Each one is identified by the connection it came from, Alertmanager's own fingerprint, and when it started.
flowchart TD
    Note["A notification arrives"] --> Kind{"What changed?"}
    Kind -->|"Nothing"| Fresh["Refresh how current<br/>the alert is. No model run"]
    Kind -->|"An annotation only"| Ignore["Ignored for<br/>investigation purposes"]
    Kind -->|"Severity, entity,<br/>impact or cause"| Reassess["New version of the signal,<br/>and a reassessment"]
    Kind -->|"Resolved"| Verify["Start recovery<br/>verification"]
A reassessment is narrow when the incident already has a trusted assessment, and complete otherwise. If the very first notification is already resolved, the platform still assesses it and then schedules the recovery check.
Labels are read for what they honestly are. A job name is monitor scope and a namespace is runtime scope; neither is promoted to a service in your catalog. You can map a candidate to a catalog service yourself, and doing so does not rewrite what the provider actually said.
A new alert always gets a new incident
A new start time creates a new alert episode, independently investigated incident, and Slack thread. The earlier occurrence remains recurrence history. Matching monitor identity and arrival time never reuse its workspace.
Alerts that arrive together
Alerts from the same connection inside one burst window, 120 seconds, are grouped as a cohort.
A cohort seals its members before analysis and exposes at most five independent incidents to one budget-admitted model call. It can record only a possible relationship or that two incidents are unrelated. Timing never proves a cause and never merges records.
A possible relationship starts one focused causal reassessment. The platform creates a directed cause only when a conclusive investigation cites durable evidence, meets the confidence threshold, and the candidate is still current. Each symptom can have one direct cause and the graph cannot contain a cycle. The direct cause owns coordinated recovery and lifecycle; every incident keeps its own evidence, conversation, and Slack thread.
You can merge incidents only after both investigations finish, and only with a reason and evidence. Splitting them again restores the original signals, threads, and states. Every causal, unrelated, merge, split, and rejection decision remains in the audit trail.
Live Alertmanager and Slack acceptance
The repository acceptance harness starts a pinned official Alertmanager against an empty isolated database and a fake investigator. It verifies exact-repeat suppression, one material reassessment, resolved and refired episodes, bounded cohort analysis, an evidence-backed causal response root, complete-group recovery, binding-scoped Slack receipts, and reversible merge and split. The harness closes its synthetic incidents and fails if any run-owned container cannot be removed.
Secrets in results
This connector has no redaction rules of its own. Prometheus already masks structured credentials in its own configuration endpoint.
The residual case is a credential written into an address, such as a username and password in a scrape target, which is known Prometheus behaviour. That is the same limit that applies to any log line. Your egress rules and per-customer credential isolation remain the real controls.