Infrastructure
What your cluster looks like right now: pods, nodes, and why any of them are unhappy.
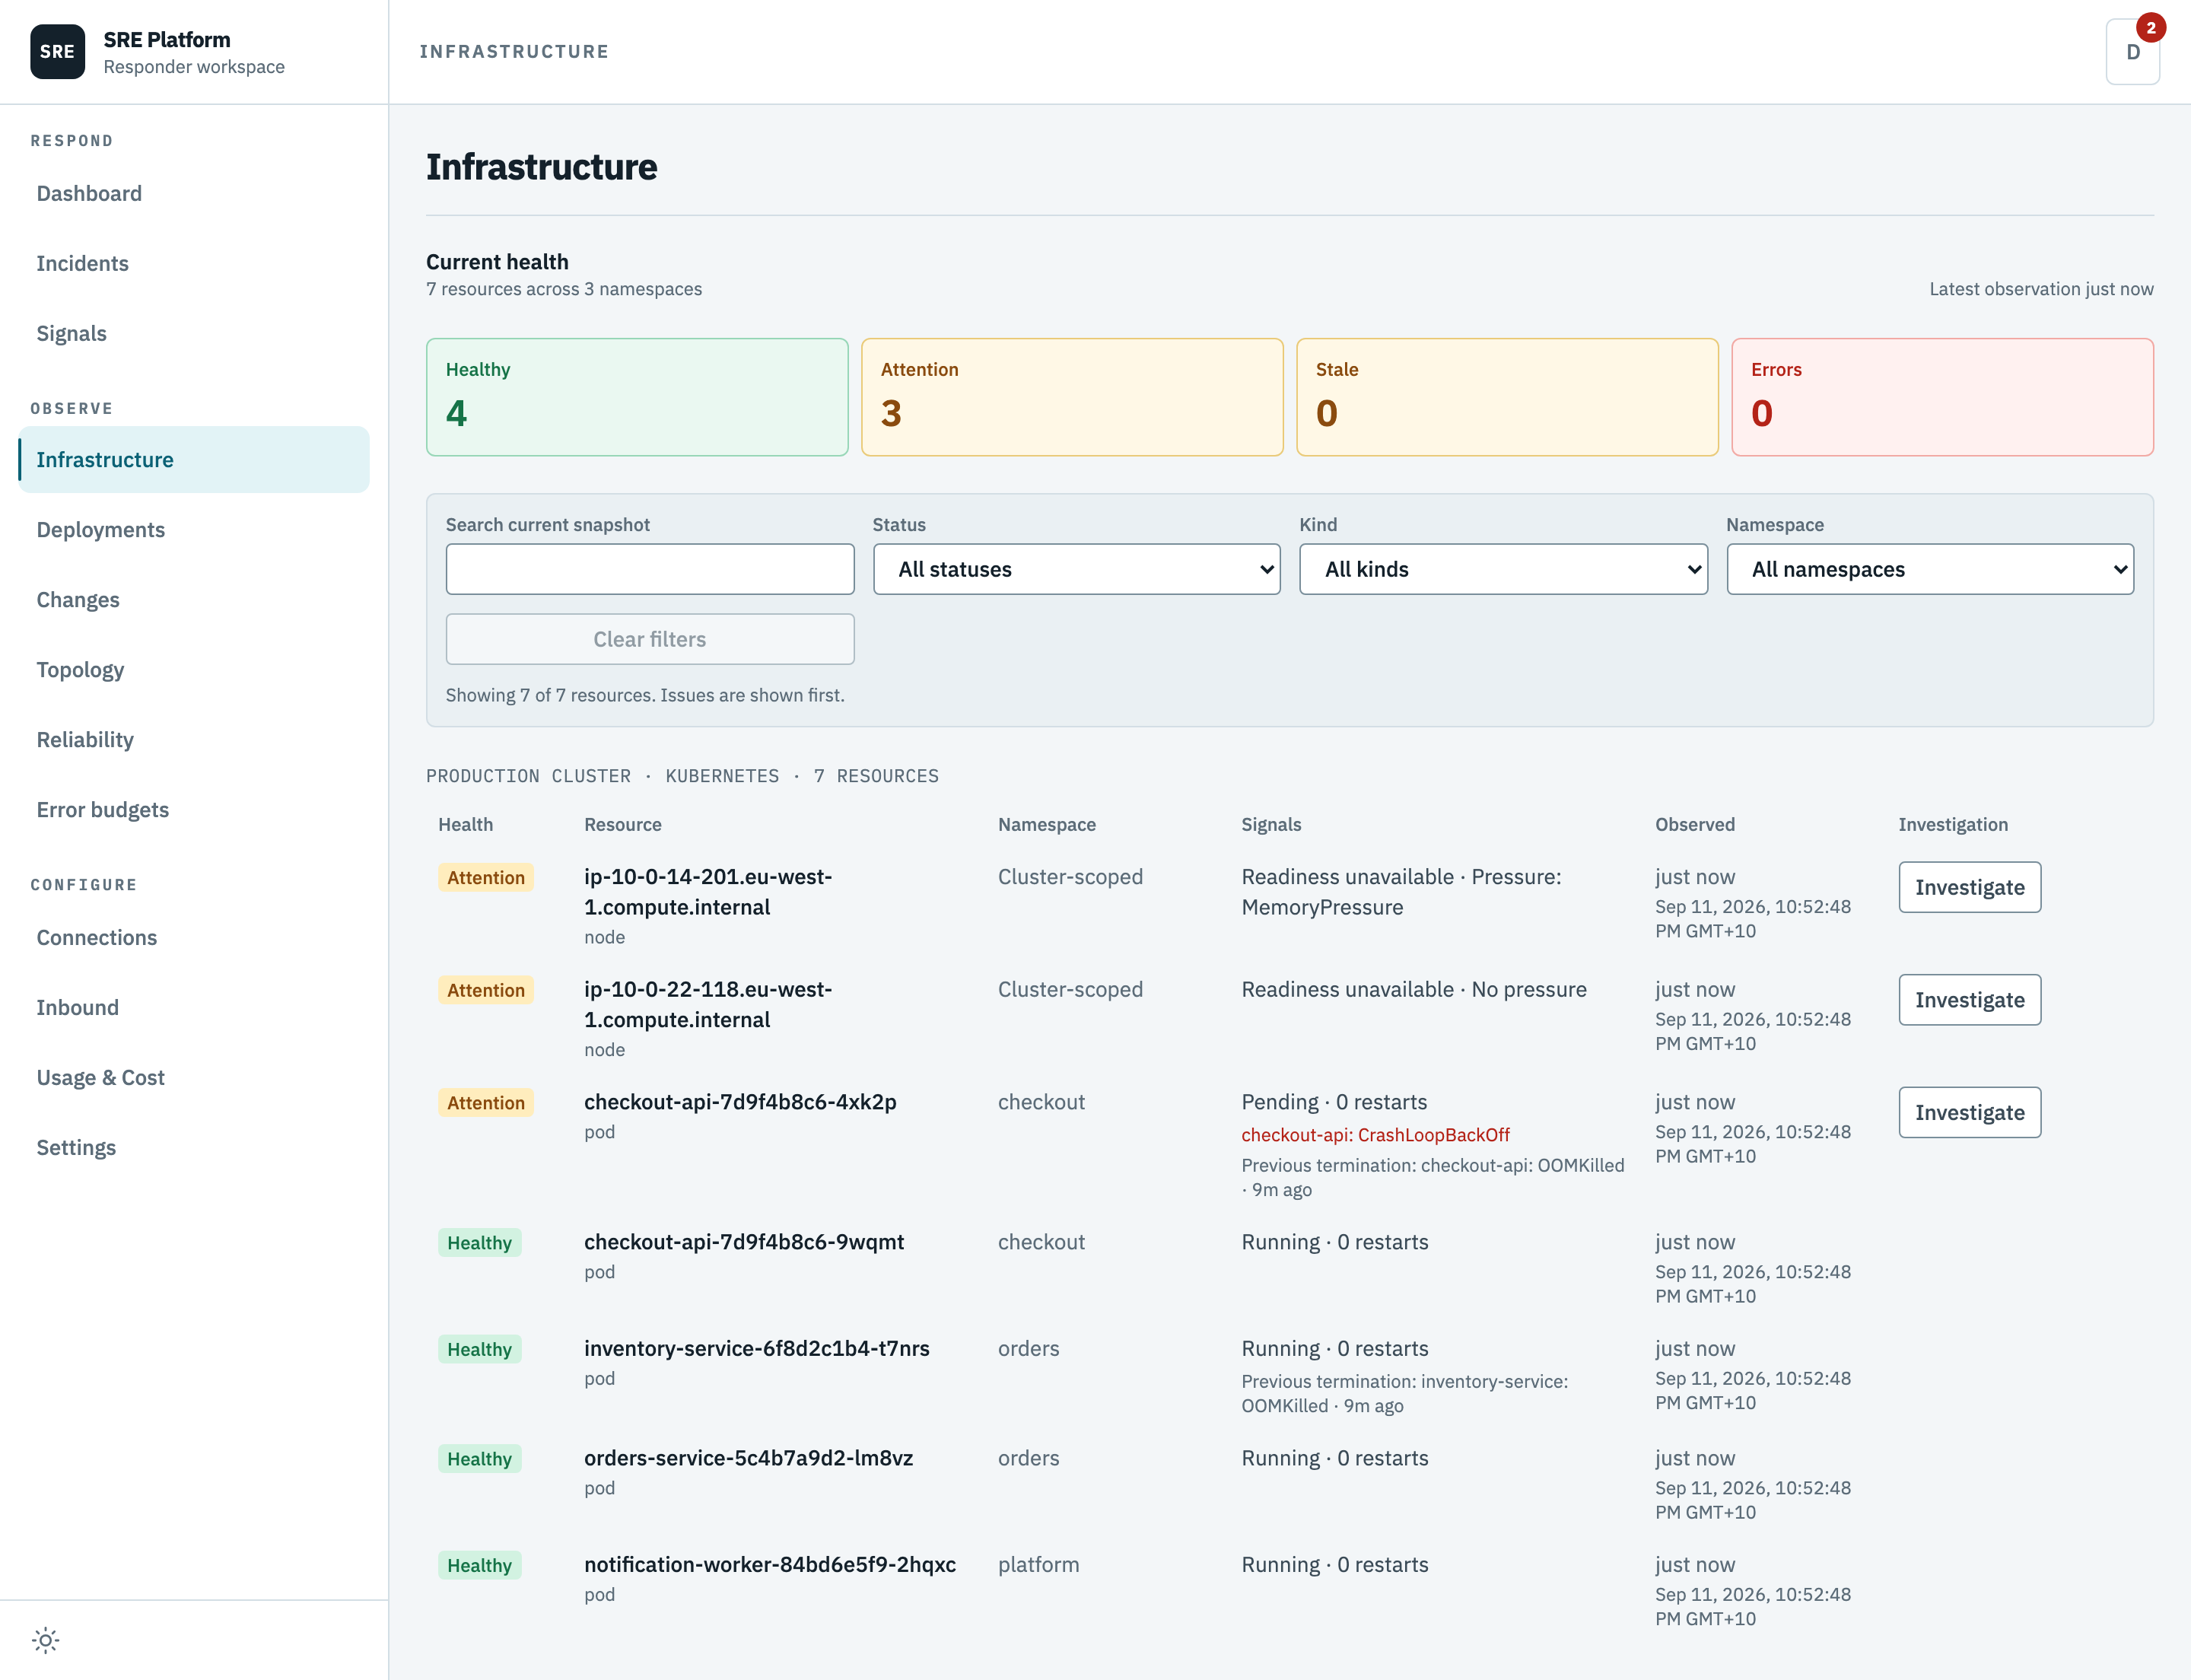
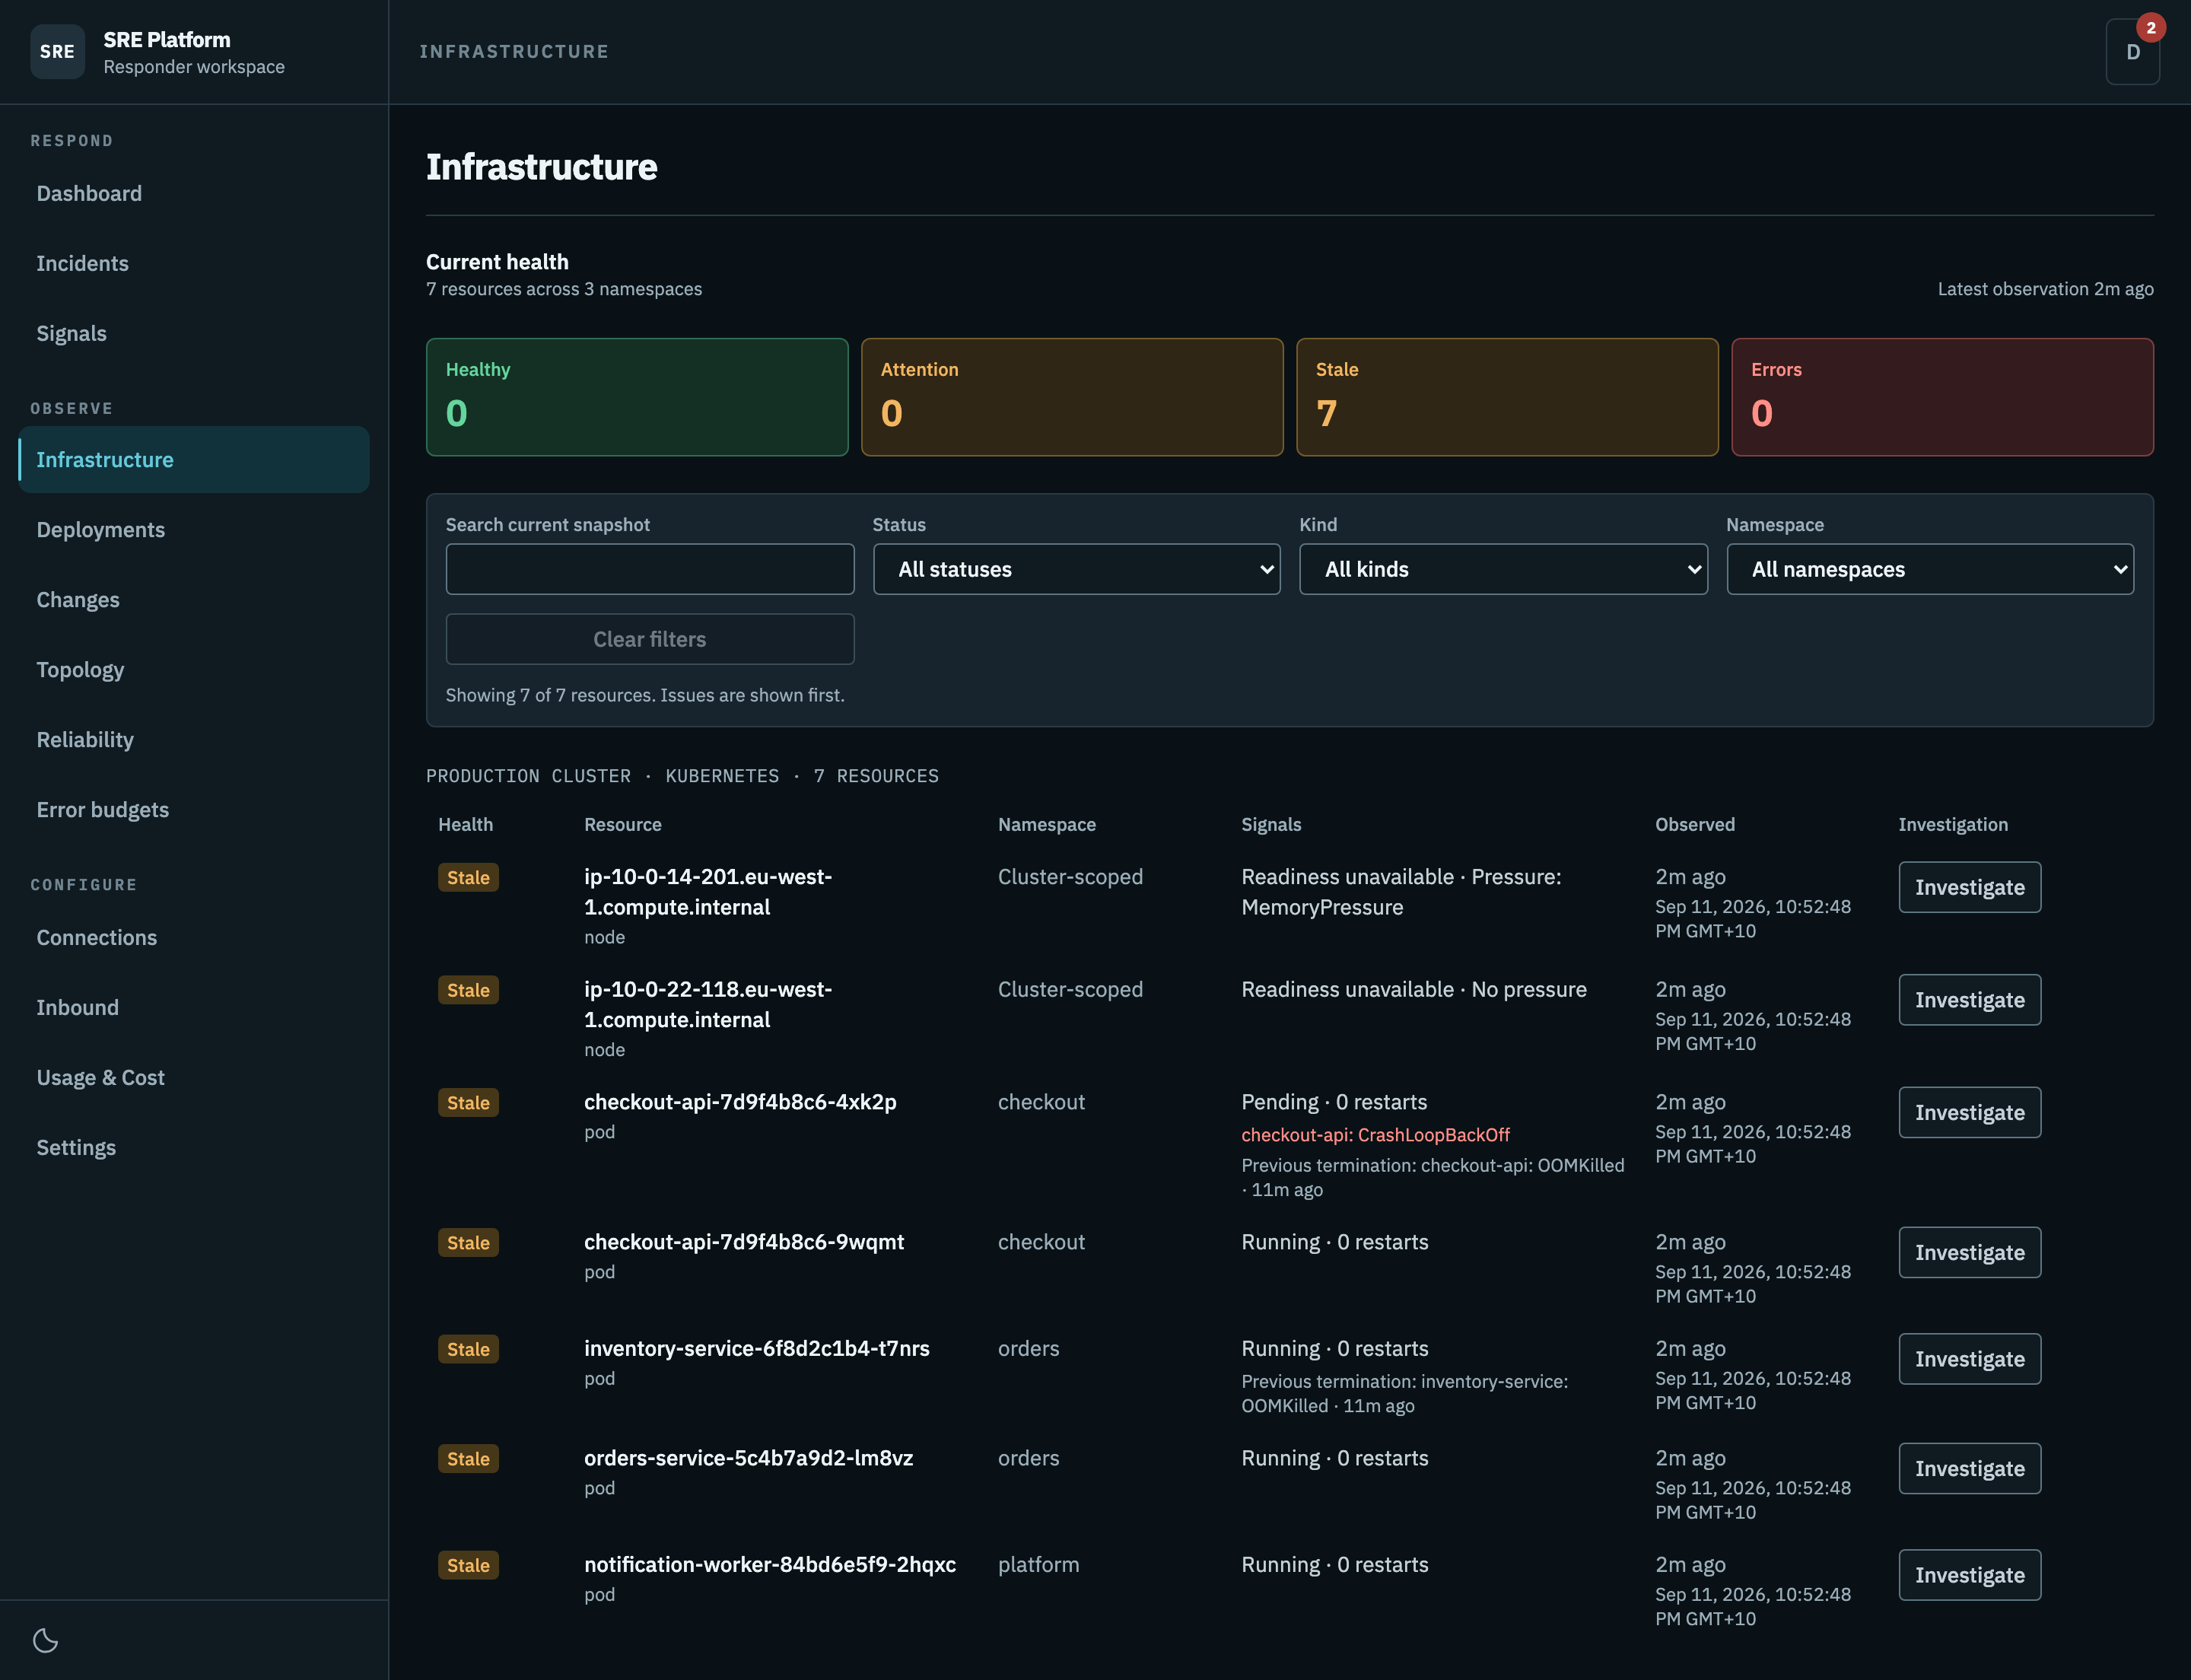
Current health
Four counts across everything the platform can see.
| Count | Means |
|---|---|
| Healthy | Running, ready, no recent restarts |
| Attention | Not ready, restarting, or under pressure |
| Stale | The last observation is too old to trust |
| Errors | The data source returned an error instead of a reading |
Stale and Errors are about the platform, not your cluster. They mean the picture is unreliable, which is a different problem from the cluster being unhealthy, and is why they are counted separately.
Filters
Search matches the resource name. Status, kind, and namespace narrow the list. Whatever you filter to, issues are shown first, so the list never buries a crash loop under forty healthy pods.
Reading a row
| Column | What it tells you |
|---|---|
| Health | The lane the resource is in |
| Resource | The name, and whether it is a pod or a node |
| Namespace | Its namespace, or cluster-scoped for a node |
| Signals | Why it is in that lane: the phase, the restart count, the container state, and any previous termination reason with its age |
| Observed | When this reading was taken, in your local time |
| Investigation | Opens an incident from this resource |
The Signals column is the one that answers "why". A row does not just say "Attention"; it says
CrashLoopBackOff, and it says the previous container was OOMKilled nine minutes ago.
Investigate
Investigate opens an incident from what the platform is looking at, for something monitoring has not alerted on. Because it was declared here rather than raised by an alert, it has no Slack thread and lives on the dashboard.
Where this comes from
flowchart LR
    Cluster["Your cluster"] --> Poll["The platform polls,<br/>read-only"]
    Poll --> Cache["Latest reading, held briefly"]
    Cache --> Page["This page"]
    Cache --> Triage["Evidence for an investigation"]
Only the most recent reading is kept, and only for a short time. This page is a live view, not a history, which is why a source that stops responding shows as Stale rather than quietly showing you yesterday.
To connect a cluster, see Kubernetes.